December 3, 2014 at 6:42 pm
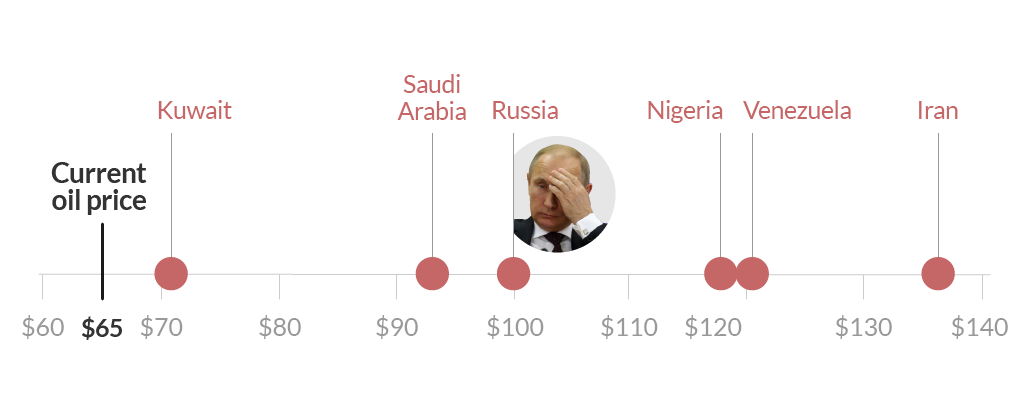
via CNN
With plunging oil prices, the consumers are clearly thrilled but the oil producers, particularly OPEC, not so much. This video below and the image, courtesy of CNN, clearly explains the gigantic complexities that impacts the price of oil. With $2/gallon already in some parts of the US, the current geopolitical scene will get even more volatile in the months ahead.

Image courtesy: CNN Money
November 21, 2014 at 5:44 pm
With gas prices falling faster than a drop of water from the sky (as we speak, the national average is well below $3 – the 1st time since Dec 22, 2010), you can expect more Americans tempted to drive instead of opting for other modes of transportation. AAA expects the travelers to spend an average of $573 over the course of their holiday travels. Click here to view the complete AAA/IHS Global Insight 2014 Thanksgiving Travel Forecast.

Image courtesy: Newsroom.AAA.com via cspnet.com
October 28, 2014 at 12:15 pm
via Forbes/Statista

Image courtesy: Statista via Forbes
Click here for the accompanying story
April 22, 2014 at 5:49 pm
The new infograph published by SafeCar.Info. offers some good insights into the real cost of owning a vehicle. To put it simply, owning a car these days is not easy on any wallet. the infograph provides a clear guide to the issues which everyone should consider before they make their final decision.

Source: SafeCar.info. Click Image to learn more.
Via: Safecar.info | Car safety & Insurance Magazine
March 18, 2013 at 6:13 pm
via Visual.ly
Here is a nice infographic that tries to answer one simple question reg. fossil fuels and their emissions..

What if we burned all the fossil fuels we have? infographic by OpenCanada.
January 28, 2013 at 7:21 pm
October 4, 2012 at 2:12 pm
Found this neat infograph via a tweet yesterday.. Couldn’t go without sharing it here.

Note: One of the subtle yet unexplored issue is the impact of America’s bulging waistlines on our national security.. It is not about our Armed forces struggling to find men and women who are physically fit. If you look at it from a macro level, the obesity issue has some serious implications for our national security. You may ask why? Because we import way too much of our oil from some of the very troubled parts of the world to haul our our people around the streets and highways of this nation. According to the U.S. Energy Information Administration (EIA), In 2011, the United States consumed about 134 billion gallons1 (or 3.19 billion barrels2) of gasoline, a daily average of about 367.08 million gallons (8.74 million barrels). This was about 6% less than the record high of about 142.38 billion gallons (or 3.39 billion barrels) consumed in 2007. Interestingly, the U.S. imported approximately 11.4 million barrels per day of petroleum in 2011 from about 80 countries (~45% net consumption is from imported oil). So, the heavier we become as a nation, the more fuel we will consume everyday. The more we import, more money goes to these troubled countries and eventually resulting in conflicts that inflict a greater loss of life. Some of these conflicts zones even have our personnel directly engaged in combat and now you see where this is going? Glad the current administration is taking steps to minimize our oil consumption with such measures as raising fuel economy standards but as a nation we still have a long way to go before we reach a secure energy future. And to get there every ounce matters.
March 15, 2012 at 7:16 pm

Image Courtesy: AAA via Grist.com
Found this interesting graphic on Grist in an article titled “How high do gas prices have to get to trigger behavior change? “. So, do Americans really change their driving habits when the gas prices rise? According to the graph, the answer is an emphatic yes. The article quotes AAA saying, ” A AAA survey conducted at the beginning of the month found 84 percent of respondents saying they have changed their driving habits or lifestyle in some way in response to recent gas-price increases, and 87 percent would change driving habits further if prices remain this high for long. The most common change adopted so far is combining trips and errands, which 60 percent of respondents say they’ve done. And 16 percent say they’ve purchased or leased a more fuel-efficient vehicle.” Read the entire article here.
Note: If the gas prices continue to rise with the drum beats of war getting louder and louder by the day, we can expect to see many drivers ditching their cars and opt to taking transit to work and to other places. I hope the transit agencies do everything in their power to demonstrate the conveniences of riding a bus/train and entice these flocking masses to continue using transit as a primary option for getting around. Oh, the big question I have in mind – Are the American transit agencies equipped to handle this sudden spike in ridership? Many transit agencies are hobbled by poor funding patterns over the years and it will be hard to meet this new segment of ridership arrives to what is an already exploding demand. Let’s see what happens. (Oh, no matter what the scenario is, one can expect to see a decline in VMT numbers again).
November 2, 2011 at 6:26 pm
(Source: Moving Solutions, Inc. via Autobloggreen)
MoveBuilder has put together an excellent infographic that has all these values, along with such esoteric numbers as the fuel consumption of NASA’s Crawler-transporter and how fast a person could pedal a bike if he or she could metabolize gasoline as efficiently as food (912mph, which would be a really good reason to stay clear of the bike lane).


