New GAO Report on Energy Markets Analyzes the Effects of Mergers and Market Concentration on Wholesale Gasoline Prices

June 26, 2009 at 2:04 pm

(Source: U.S. Government Accountability Office)

Background

In 2008, GAO reported that 1,088 oil industry mergers occurred between 2000 and 2007. Given the potential for price effects, GAO recommended that the Federal Trade Commission (FTC), the agency with the authority to maintain petroleum industry competition, undertake more regular retrospective reviews of past petroleum industry mergers, and FTC said it would consider this recommendation. GAO was asked to conduct such a review of its own to determine how mergers and market concentration—a measure of the number and market shares of firms in a market—affected wholesale gasoline prices since 2000.

GAO examined the effects of mergers and market concentration using an economic model that ruled out the effects of many other factors. GAO consulted with a number of experts and used both public and private data in developing the model. GAO tested the model under a variety of assumptions to address some of its limitations. GAO also interviewed petroleum market participants.

Study Findings

Image Courtesy: GAO

GAO examined seven mergers that occurred since 2000—ranging in value and geography and for which there was available gasoline pricing data (see table)—and found three that were associated with statistically significant increases or decreases in wholesale gasoline prices. Specifically, GAO found that the mergers of Valero Energy with Ultramar Diamond Shamrock and Valero Energy with Premcor, which both involved the acquisition of refineries, were associated with estimated average price increases of about 1 cent per gallon each. In addition, GAO found that the merger of Phillips Petroleum with Conoco, which primarily involved the acquisition of oil exploration and production assets, was associated with an estimated average decrease in wholesale gasoline prices across cities affected by the merger of nearly 2 cents per gallon. This analysis provides an indicator of the impact that petroleum industry mergers can have on wholesale gasoline prices. Additional analysis would be needed to explain the price effects that GAO estimated.

GAO used two separate measures of market concentration, one which measured the number of sellers at wholesale gasoline terminals and another which measured the market share of refiners supplying gasoline to those sellers, and found that less concentrated markets were statistically significantly associated with lower gasoline prices. For example, for wholesale terminals with more sellers—i.e., terminals that were less concentrated—GAO estimated that prices were about 8 cents per gallon lower at terminals with 14 sellers than at terminals that had only 9 sellers. This result is consistent with the idea that markets with more sellers are likely to be more competitive, resulting in lower prices. Using the second measure of concentration, GAO similarly found a statistically significant association between prices and the level of refinery concentration, with less concentrated groups of refineries associated with lower prices.

GAO Recommendation

This study reinforces the need to review past petroleum industry mergers, and GAO continues to recommend that FTC conduct such reviews more regularly and develop risk-based guidelines to determine when to conduct them. FTC reviewed a draft of this report and supports GAO’s recommendation to conduct more reviews of past petroleum industry mergers.

Click here to download the full report.

U.S. GAO Report on Aviation Safety Says Better Data and Targeted FAA Efforts Needed to Identify and Address Safety Issues of Small Air Cargo Carriers

June 25, 2009 at 6:35 pm

(Source: U.S. GAO)

Image Courtesy: GAO

The air cargo industry contributed over $37 billion to the U.S. economy in 2008 and provides government, businesses, and individuals with quick delivery of goods. Although part of an aviation system with an extraordinary safety record, there have been over 400 air cargo accidents and over 900 incidents since 1997, raising concerns about cargo safety.

GAO’s congressionally requested study addresses:

(1) recent trends in air cargo safety,

2) factors that have contributed to air cargo accidents,

(3) federal government and industry efforts to improve air cargo safety and experts’ views on the effectiveness of these efforts, and

(4) experts’ views on further improving air cargo safety.

To perform the study, GAO analyzed agency data, surveyed a panel of experts, reviewed industry and government documents, and interviewed industry and government officials. GAO also conducted site visits to Alaska, Ohio, and Texas.

From 1997 through 2008, 443 accidents involving cargo-only carriers occurred, including 93 fatal accidents. Total accidents declined 63 percent from a high of 62 in 1997 to 23 in 2008. Small cargo carriers were involved in the vast majority of the accidents–79 percent of all accidents and 96 percent of fatal accidents. Although accident rates for large cargo carriers fluctuated during this period, they were comparable to accident rates for large passenger carriers in 2007.

GAO could not calculate accident rates based on operations or miles traveled for small carriers because the Federal Aviation Administration (FAA) does not collect the necessary data. Although several factors contributed to these air cargo accidents, our review of National Transportation Safety Board (NTSB) data found that pilot performance was identified as a probable cause for about 80 percent of fatal and about 53 percent of non-fatal cargo accidents.

Furthermore, GAO’s analysis of NTSB reports for the 93 fatal accidents, using an FAA flight-risk checklist, identified three or more risk factors in 63 of the accidents. Risk factors included low pilot experience, winter weather, and nighttime operations. Alaska’s challenging operating conditions and remotely located populations who rely on air cargo are also a contributing factor. Many federal efforts to improve air cargo safety focus on large carriers.

Air cargo experts that GAO surveyed ranked FAA’s voluntary disclosure programs–in which participating carriers voluntarily disclose safety events to FAA–as the most effective effort to improve air cargo, but two of the three main voluntary disclosure programs are used typically by large carriers. Several industry initiatives, however, focus on carriers with smaller aircraft, such as the Medallion Foundation, which has improved small aircraft safety in Alaska through training and safety audits.

The two actions experts cited most often to further improve air cargo safety were installing better technology on cargo aircraft to provide additional tools to pilots and collecting data to track small cargo carrier operations. Using flight risk checklists can also help pilots assess the accumulated risk factors associated with some cargo flights.

Recommendations:

  • To help FAA improve the data on and the safety of air cargo operations, the Secretary of Transportation should direct the FAA Administrator to gather comprehensive and accurate data on all part 135 cargo operations to gain a better understanding of air cargo accident rates and better target safety initiatives. This can be done by separating out cargo activity in FAA’s annual survey of aircraft owners or by requiring all part 135 cargo carriers to report operational data as part 121 carriers currently do.
  • To help FAA improve the data on and the safety of air cargo operations, the Secretary of Transportation should direct the FAA Administrator to promote the increased use of safety programs by small (feeder and ad hoc) cargo carriers that use the principles underpinning SMS and voluntary self-disclosure programs.
  • To help FAA improve the data on and the safety of air cargo operations, the Secretary of Transportation should direct the FAA Administrator to evaluate the likelihood that cargo incidents could be precursors to accidents and, if FAA determines they are, create a process for capturing incidents that would allow in-depth analysis of incidents to identify accident precursors related to specific carriers, locations, operations, and equipment.
  • To help FAA improve the data on and the safety of air cargo operations, the Secretary of Transportation should direct the FAA Administrator to create incentives for cargo carriers to use flight risk assessment checklists in their daily operations, including tailoring a sample flight risk assessment checklist for part 135 cargo carriers.

Click here to read/download the entire report (60 Pages).

GAO Report on Highway Trust Fund Discusses Options for Improving Sustainability and Mechanisms to Manage Solvency

June 25, 2009 at 5:46 pm

(Source: GAO)

The Highway Account within the Highway Trust Fund (HTF) is the principal means for funding federal highway programs. Administered by the Federal Highway Administration (FHWA) within the Department of Transportation (DOT), it channels about $33 billion in highway user excise taxes annually to states for highway and related spending.

Estimated outlays from the Highway Account under the Safe, Accountable, Flexible, Efficient Transportation Equity Act—A Legacy for Users (SAFETEA-LU) exceeded estimated receipts throughout the authorization period—fiscal years 2005 through 2009. Furthermore, actual account receipts were lower than had been estimated and the account balance dropped more rapidly than anticipated, approaching zero in August, 2008. Congress subsequently approved legislation in September 2008 to appropriate $8 billion from the General Fund of the Treasury to replenish the account. Agency officials anticipate the account will reach a critical stage again before the end of fiscal year 2009, and estimate that about $15 billion will be needed to ensure account solvency through the end of fiscal year 2010.

This report summarizes GAO’s past work on:

  • The collection and distribution process for the Highway Account of the HTF,
  • Options for improving long-term sustainability of the HTF, and
  • Mechanisms to help manage Highway Account solvency.

Image Courtesy: GAO

The collection and distribution of funds through the Highway Account is a complex process. Collection involves Treasury receiving excise taxes from business entities, estimating how much should be allocated to the Highway Account, and adjusting the estimated allocation several months later after actual tax receipts are certified. Distribution begins with a multi-year authorization act that provides contract authority and establishes annual funding levels.

DOT apportions the contract authority to the states and divides the funding level among federal highway programs and states. DOT then obligates funds for projects and reimburses states as projects are completed. Improving long-term sustainability is one of GAO’s key principles for restructuring existing transportation programs, and GAO has reported on options for improving sustainability:

  • Improve the efficiency of current facilities,
  • Alter existing sources of revenue,
  • Ensure users are paying fully for benefits, and
  • Supplement existing revenue sources, such as through enhanced private-sector participation.

Each of these options has different merits and challenges, and will likely involve trade-offs among different policy goals. Improving existing mechanisms intended to help maintain Highway Account solvency could help DOT better manage the account balance. For example, statutory mechanisms designed to make annual adjustments to the Highway Account have been so modified over time–particularly through changes in SAFETEA-LU–that they either are no longer relevant or are limited in effectiveness. Furthermore, monitoring indicators that could signal sudden changes in revenues could help DOT better anticipate changes in the account balance and communicate with stakeholders on the account’s status.

DOT is acting on recommendations GAO made in February, 2009 to help improve solvency mechanisms and communication with stakeholders.

Click here to download the entire report.

Quit playing with your phone: Texting And Driving Worse Than Drinking and Driving

June 25, 2009 at 2:11 pm

(Source: Jalopnik & Oregon Live, Car and Driver & CNBC)

If you use a cell phone, chances are you’re aware of “text messaging”—brief messages limited to 160 characters that can be sent or received on all modern mobile phones.  Texting, also known as SMS (for short message service), is on the rise, up from 9.8 billion messages a month in December ’05 to 110.4 billion in December ’08. Undoubtedly, more than a few of those messages are being sent by people driving cars. Is texting while driving a dangerous idea?

Image Courtesy: Jalopnik

The boys fromCarandDriver spent time determining just how bad it really is versus, say, drunk driving. Turns out drunk driving‘s safer. Here’s why.  Drivers distracted by texting are four times slower to brake to avoid a collision than those driving under the influence.  (The results in a nutshell:  Unimpaired: .54 seconds to brake; Legally drunk: add 4 feet; Reading e-mail: add 36 feet; Sending a text: add 70 feet.  If are somene who has a lot of time to spare, continue reading the test details and the explanation of the test results conducted in different scenarios.)

The testers wired a Racelogic VBOX III data logger to the test vehicle (in this case a Honda Pilot) to record vehicle speed via the VBOX’s GPS antenna and brake-pedal position and steering angle via the Pilot’s OBD II port. The testers then wired a red light to the windshield to play the role of brake lights from an imaginary car ahead of the Pilot. When the red light lit up, the driver’s supposed to hit the brakes.    Each trial, one with a younger test candidate (Jordan Brown) and using an iPhone, the other with old man (Eddie Alterman) and a Samsung Alias, would have the driver respond five times to the light, and the slowest reaction time — the time between activation of the light and driver hitting the brakes — was dropped.

Image Courtesy: Car & Driver

The results from the first test scenario involving the younger driver are as follows:

  • The younger driver’s  baseline reaction time at 35 mph of 0.45 second worsened to 0.57 while reading a text, improved to 0.52 while writing a text, and returned almost to the baseline while impaired by alcohol, at 0.46. At 70 mph, his baseline reaction was 0.39 second, while the reading (0.50), texting (0.48), and drinking (0.50) numbers were similar. But the averages don’t tell the whole story.
  • Looking at the younger driver’s slowest reaction time at 35 mph, he traveled an extra 21 feet (more than a car length) before hitting the brakes while reading and went 16 feet longer while texting. At 70 mph, a vehicle travels 103 feet every second, and older driver’s worst reaction time while reading at that speed put him about 30 feet (31 while typing) farther down the road versus 15 feet while drunk.

The results from the 2nd test scenario involving the older driver are as follows:

  • While reading a text and driving at 35 mph, the older driver’s average baseline reaction time of 0.57 second nearly tripled, to 1.44 seconds. While texting, his response time was 1.36 seconds. These figures correspond to an extra 45 and 41 feet, respectively, before hitting the brakes. His reaction time after drinking averaged 0.64 second and, by comparison, added only seven feet.
  • The results at 70 mph were similar:  The older response time while reading a text was 0.35 second longer than his base performance of 0.56 second, and writing a text added 0.68 second to his reaction time. But his intoxicated number increased only 0.04 second over the base score, to a total of 0.60 second.

Well, do you know what’s happening in the real world?  According to one industry study, still, 20 percent of drivers regularly send texts or e-mails on the road.  Governments at all levels (State, Local and Federal) are combating the texting meance with a legal and PR campaigns.  As of now, 14 states have banned driving while using handheld cell phones and a bunch of them are expected to join the bandwagon. in teh near future (Oregon is reportedly on the verge of enacting a ban).  Click here to watch a video of this story that appeared in this morning’s Today’s show.

Smart Black Box – Coming Soon to a car next to you!

June 25, 2009 at 11:45 am

(Source: Wired)

Image Courtesy: Wired

A company that provides communications systems to law enforcement agencies around the world has developed a black box similar to those used in aircraft to record crash data in cars.

The Smart Black Box by KCI Communications sticks to your windshield and uses a built-in camera, GPS unit and G-force shock sensor to document accidents. The info could come in handy when trying to determine fault or explain to your insurance company just what happened when you crunched your car.  KCI says the GPS unit will record the time and location of an accident and document your speed and direction of travel. The company says that could be useful when trying to prove that red light you ran was actually yellow or in cases where you dispute the reading on a cop’s radar.

The Smart Black Box costs about $300 and constantly records video footage on a loop as you drive. Should the shock sensor detect an accident, the device saves the 15 seconds prior to impact and the 5 seconds afterward. The footage is saved to a SD Card, like that found in your digital camera, making it accessible on a home computer.

Click here to read the entire article.

Webinar Alert: ITS America Announces Webinar Series on Climate Change and Transportation

June 24, 2009 at 11:36 am

The Intelligent Transportation Society of America (ITS America) is pleased to announce a series of Webinars focusing on how climate change can affect surface transportation.


  • “What Does Climate Change Legislation Mean for Surface Transportation?”  – Wednesday, July 8,  from 2 p.m. to 3:30 p.m.
  • “How is California Addressing Surface Transportation Issues?” – Wednesday, July 15, from 2 p.m. to 3:30 p.m.
  • “What is Detroit Doing to Alleviate Environmental Concerns in Surface Transportation?” –  Wednesday, July 22 from 2 p.m. to 3:30 p.m.

The registration fee for members of ITS America is $45 per Webinar (or $105 for the series) and $90 per Webinar for nonmembers or ($240 for the series).

To register, download the registration form here.

Transportation Reauthorization (STAA) Updates: Media Round-up June 24, 2009

June 24, 2009 at 10:02 am

(Source:  Minnesota Public Radio, The Hill, The Trucker, Detroit Free Press, Transportation for America)

Image Courtesy:USDOT Secretary Ray LaHood's Blog - Fast Lane

Legislative Journey Begins:

Congressman Jim Oberstar’s transportation bill starts its legislative journey today with a draft session scheduled in a House of Representatives subcommittee.

It’s the one of the first steps toward a vote for the bill, which would nearly double current spending. The Obama administration has proposed postponing reform, but Oberstar says waiting dooms the country to years of delay on transportation projects.

Oberstar’s Surface Transportation Authorization Act would provide $337 billion in funding for highway construction, $100 billion for public transit and $50 billion to build a nationwide high-speed rail system–a grand total of nearly $500 billion over six years.

Funding for the bill remains sketchy, though Oberstar promises details as it progresses. There’s been no talk of increasing the federal gasoline tax which hasn’t been raised for 16 years.

Oberstar rails against the Obama administration position, saying an 18-month delay, given how Congress does its work, translates into a four-year wait for federal money from a new federal transportation bill. Oberstar’s timeline for finishing work on a new federal transportation bill is ambitious. He wants a vote no later than just after Labor Day.

LaHood told a Senate Appropriations transportation panel last week that he wants to work in the 18-month extension for the kinds of program changes that lawmakers seek.

“Our number one priority is to fix the Highway Trust Fund, to pay for it, to find money, and along the way here if we can have the discussions about these other things, I think we should,” LaHood said.

But Sen. Patty Murray, a Washington Democrat and the committee’s chairman, said: “Conversations are great; passing legislation is hard.” She said she was “concerned about some of the lack of details … You’re offering a general framework for us, but we can’t wait very long for a proposal.”

Unlikely Ally – K Street:

Rep. Jim Oberstar (D-Minn.) has a powerful ally in his battle with the White House over the highway bill: K Street.

Trade associations, unions and business coalitions are getting behind the House Transportation Committee chairman in his push to complete the $450 billion measure before the fiscal year ends on Sept. 30. The Obama administration has argued the transportation reauthorization bill is a bridge too far for an already jam-packed legislative agenda and wants to extend the current law at least 18 months before Capitol Hill can take on new reforms.

But lobbyists are arguing that the debate over how best to pay the increased transportation funding Oberstar is proposing — whether it is through raising the tax on gasoline or taxing vehicle mileage — cannot wait any longer.

But the administration has opposed lawmakers who wish to raise the gas tax to pay for the new transportation bill. LaHood and others argue the new tax hike would be overly burdensome on the pocketbooks of ordinary Americans during the recession.

Lobbyists believe the legislation, which will help fund repairs not only to highways but to transit systems and railroads, will provide a boost to the nation’s economy, much like the stimulus package was designed to do.

For his push to finish the bill before the end of the fiscal year, Oberstar can expect to find support among many of the trade associations that have been lobbying the transportation reauthorization this year. Like AAPA and LIUNA, the American Association of State Highway and Transportation Officials and the Associated General Contractors of America are also supportive of the Minnesota Democrat’s desire to complete the bill in 2009, according to statements they released last week.

Many praised several reforms that were included in Oberstar’s blueprint released last week, including creating a Transportation Department Office of Intermodalism to better organize the nation’s transportation system and a national infrastructure bank to fund transportation projects.

Strong provisions for monitoring drug and alcohol abuse by truckers

The draft of the new highway reauthorization bill authored primarily by Rep. James Oberstar, chairman of the House Transportation and Infrastructure Committee contains strong language requiring the Secretary of Transportation to establish a clearinghouse for records relating to alcohol and controlled substances testing of commercial motor vehicle operators.

It’s a clearinghouse long desired by federal officials and trucking executives and would be designed to keep repeat substance abuse offenders from jumping from company to company.

The clearinghouse would be a repository of records relating to violations of the testing program by individuals submitted to the DOT.

The bill requires the clearinghouse to be in operation not later than one year after the enactment of the new highway bill.

Under the present system, a CDL holder can fail a drug test and be fired from his or her present employer, but is not required to tell a prospective new employer about the failed test.

D.C. Metro Crash Spurs Transit Funding Debate

Public transit advocates seized on Monday’s commuter rail crash in Washington to make the case for overhauling the country’s transportation system.  Authorities were still searching the wreckage Tuesday when Transportation for America, a coalition of interest groups and local officials, cited the deadliest crash in the Metro’s 33-year history to make the case for advancing a new transit authorization bill on Capitol Hill this year.

“In the big picture, what we can say is that we have underinvested in taking care of our infrastructure, roads, bridges and public transportation,” said James Corless, director of Transportation for America.

Lawmakers from around the Washington area also spoke of the need to pay for rail projects in the wake of the crash, which killed nine people and injured 76, although some cautioned not to draw conclusions before investigators determine what led the two trains on the red line to collide.

Del. Eleanor Holmes Norton (D-D.C.) called for a congressional hearing Tuesday to help determine how the crash occurred.

Norton, after meeting with officials of the National Transportation Safety Board, expressed outrage that the older car in the crash wasn’t retired, as those officials had recommended years ago. She noted that Congress once heard safety officials testify for more funding to maintain the Metrorail system, and that appropriators have failed to fully fund their request.

“Congress had the ultimate wake-up call yesterday,” she said. “The only appropriate response is to begin to eliminate the crash-unworthy cars with this year’s appropriations.”

Webinar Alert: Advancing Traffic Signal Management Programs through Regional Collaboration – Talking Technology and Transportation (T3) Webinar @ July 23, 2009

June 23, 2009 at 2:47 pm

Advancing Traffic Signal Management Programs through Regional Collaboration

Date: July 23, 2009

Time: 1:00–2:30 P.M. ET

Cost: All T3s are free of charge

PDH: 1.5. — Webinar participants are responsible for determining eligibility of these PDHs within their professions.

Register On-line

Contact the T3 Administrator

Description

This T3 webinar will explore Regional Traffic Signal Management Programs from an intuitional and organizational perspective. Over the last decade, Regional Traffic Signal Management Programs have developed in many metropolitan areas with the primary objective of improving traffic signal timing. How successful have these programs been at achieving and sustaining this objective? What types of organizational structures, funding, and technology facilitate the operation of the system? There are many approaches to starting, organizing, and sustaining regional programs; a cross section of these, will be explored from the perspective of State DOTs, Metropolitan Planning Organizations and Local Agencies. The activities, funding sources and champions that sustain regional programs are as diverse as the regions themselves; exploring and discussing these is an important step in improving and advancing traffic signal operations nationally.

The webinar will include brief presentations describing each regional traffic signal program followed by a Question & Answer discussion of questions submitted by webinar participants.

Audience

Politicians, managers and practitioners interested in improving traffic signal management, operations and maintenance practices to reduce the impacts of traffic signals on climate change, improve the quality of life of customers and advancing a world class transportation system that interoperates across multiple modes and facilities.

Learning Objectives

  • Identify approaches to “sell” regional traffic signal programs as a viable strategy to improve traffic signal operations.
  • Identify organizational structures and methods of overcoming institutional barriers to the formation of regional traffic signal management programs.
  • List activities that promote regional collaboration among traffic signal operators.
  • Identify how planning organizations and agencies that manage and operate traffic signals can work collaboratively to improve traffic signal operations.
  • List the benefits of regional traffic signal operations.
  • Identify emerging strategies for measuring performance and prioritizing regional objectives and projects.

Federal Host:

Eddie Curtis, FHWA Resource Center & Office of Operations

Eddie Curtis is a Traffic Management Specialist with the FHWA Resource Center and Headquarters Office of Operations. He manages the Arterial Management Program responsible for providing research, guidance and outreach to advance arterial operations and traffic signal management. Via the Resource center Mr. Curtis provides training and technical assistance on issues related to traffic signal management, operations and ACS-Lite. He has 14 years of experience in traffic signal operations and has held positions with the City of Los Angeles and PB Farradyne. He holds a bachelor’s degree in Civil Engineering from California State University Los Angeles and is a licensed P.E. in the states of California.

Presenters:

State Department of Transportation Perspective on Regional Traffic Signal Management

  • North Carolina Department of Transportation

Greg Fuller, North Carolina DOT — ITS & State Signals Engineer

  • Metropolitan Planning Organization Perspective

Jim Poston, Regional Transportation Commission (RTC)

Metropolitan Planning Organization Perspective

Ronald Achelpohl is the Assistant Director of Transportation for the Mid-America Regional Council (MARC). He is responsible for a variety of initiatives related to the funding, operation and management of transportation systems in the Kansas City area including:

    • Project Manager for Operation Green Light; an initiative to enhance the coordination of traffic signals to improve traffic flow and air quality throughout the region;
    • Program Manager for the regional Congestion Management System to ensure that regional decision-makers have solid information about the impacts of congestion as they make major transportation investment decisions;
    • Oversight of regional transportation safety programs;
    • Oversight of the Regional Intelligent Systems Architecture;
    • Oversight of the regional Transportation Improvement Program;
    • Oversight of the regional RIDESHARE program; and
    • Other initiatives involving Intelligent Transportation Systems, Travel Demand Management, freight transportation, transportation finance and transportation policy.

Ronald has held previous positions in MARC and the Missouri Department of Transportation and has earned a Master of Science, Engineering Management from the University of Kansas and a Bachelor of Science, Civil Engineering from the University of Missouri.

Ronald is a Registered Professional Engineer in Missouri and a member of the American Public Works Association, the Institute of Traffic Engineers, and ITS America, Heartland Chapter.

Professional Organization Perspective

Douglas Noble is the Senior Director — Management and Operations at the Institute of Transportation Engineers. He is responsible for the integration of transportation management and operations issues into ITE programs and publications. Doug has more than 20 years of experience in project development, financial management and administration in the transportation engineering field with an emphasis in project management, organizational development and change management, traffic engineering, transportation operations, neighborhood traffic management and planned special events.

Doug’s professional background spans both the public and private sectors: He has been the Chief Traffic Engineer for Washington, DC and prior to that a principal transportation engineer for the consulting engineering firm Parsons Transportation Group in its Washington office. He received his bachelor’s degree in civil engineering from Purdue University, and an M.S.E. in transportation systems from the University of Texas at Austin. In addition to being registered as a Professional Engineer, Doug has received certification as a Professional Traffic Operations Engineer™ and is a Fellow of the Institute.

Global Status Report on Road Safety – World Health Organization’s Report Explores Status of Road Safety in 178 Countries

June 23, 2009 at 12:52 pm

Do you know that over 90% of the world’s fatalities on the roads occur in low-income and middle-income countries, which have only 48% of the world’s registered vehicles?

  • 1.2 million people will die this year as a result of road crashes – more than 3200 deaths each day.
  • About 50 million people will be injured in road crashes this year, millions of whom will be disabled for life.
  • 90% of deaths due to road crashes occur in developing countries, mostly among pedestrians, bicyclists and motorcyclists – those less likely to own a car.
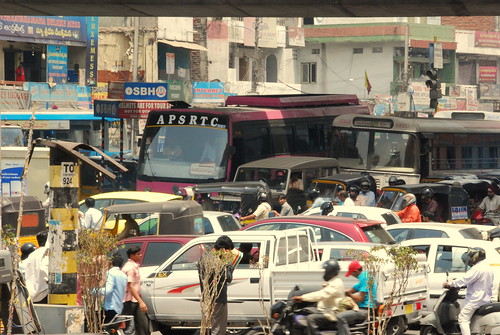
  • Road crashes cost low- and middle-income countries an estimated US $ 65 Billion each year – more than they receive in development aid.
  • Image Courtesy: World Health Organization

    Approximately 1.3 million people die each year on the world’s roads, and between 20 and 50 million sustain non-fatal injuries. In most regions of the world this epidemic of road traffic injuries is still increasing. In the past five years most countries have endorsed the recommendations of the World report on road traffic injury prevention which give guidance on how countries can implement a comprehensive approach to improving road safety and reducing the death toll on their roads.

    To date, however, there has been no global assessment of road safety that indicates the extent to which this approach is being implemented. This Global status report on road safety is  the first broad assessment of the status of road safety in 178 countries, using data drawn from a standardized survey conducted in 2008.

    The results show that road traffic injuries remain an important public health problem, particularly for low-income and middle-income countries. Pedestrians, cyclists and motorcyclists make up almost half of those killed on the roads, highlighting the need for these road users to be given more attention in road safety programmes.

    Image Courtesy: Apture

    The results also suggest that in many countries road safety laws need to be made more comprehensive while enforcement should be strengthened. TheGlobal status report on road safety results clearly show that significantly more action is needed to make the world’s roads safer.

    The results provide a benchmark that countries can use to assess their road safety position relative to other countries, while internationally the data presented can collectively be considered as a global “baseline” against which progress over time can be measured.  Here is a quick summary of key findings from WHO’s Director-General, Dr. Margaret Chan’s  statement during the June 15, 2009 release of the report in New York City:

    • Over 90% of these deaths occur in low-income and middle-income countries, which have less than half of the world’s registered vehicles.
    • Second, the report highlights that nearly half of those dying on the world’s roads are pedestrians, cyclists or motorcyclists. These people, who lack the protective shell of a car, are particularly vulnerable to severe and fatal injuries following a crash.  In some low-income and middle-income countries, this proportion is even higher, with up to 80% of road traffic deaths among these vulnerable groups. Clearly we are not giving enough attention to the needs of pedestrians, cyclists and motorcyclists, many of whom end up in clinics and emergency rooms, overloading already stretched health-care systems.
    • Third, the report shows that, in many countries, the laws needed to protect people are either not in place or too limited in their scope. Indeed, only 15% of countries have comprehensive laws on all the risk factors we measured. And even when legislation is adequate, most countries report that enforcement is low.  The development and effective enforcement of legislation are key ways to reduce drink-driving and excessive speed, and to increase the use of helmets, seat-belts and child restraints.
    • Finally, the report demonstrates that in many countries information about road traffic injuries is scarce. To set priorities and target and evaluate their actions, countries need to know the size of the problem, and additional information such as which groups are most affected.

    Click here to access the PDF report.

    J.D. Power 2009 Initial Quality Study Results: Detroit closes in on Toyota in key quality measure; Lexus leads, Hyundai improves, while Infiniti drops in

    June 22, 2009 at 3:12 pm

    (Source: Wall Street Journal, Detroit Free Press,  Reuters, Autoblog, JDPower.com)

    * Ford, Chevrolet close in on Toyota brand

    * Lexus, Porsche rank No. 1 and No. 2 for new car quality

    * BMW’s Mini ranks last in J.D. Power survey

    New vehicles sold by Chrysler, Ford and GM’s domestic brands have improved in initial quality by an average of 10% compared with 2008, but Toyota Motor Corp. was the star of this year’s study on initial quality from J.D. Power and Associates.

    The study was released today at an Automotive Press Association luncheon at the Detroit Athletic Club.

    Image Courtesy: J.D Power and Associates via Autoblog

    Toyota’s Lexus brand ranked first among all nameplates with 84 problems per 100 vehicles. Toyota also captured 10 segment awards — more than any other corporation in the 2009 study.

    Luxury brands captured the top three spots, while Chevrolet, Ford and Toyota were in what amounted to a statistical dead heat further down in the rankings, the survey by J.D. Power and Associates found.

    “Have the leading domestic nameplates caught up with Toyota? The answer is almost,” Dave Sargent, vice president for auto research at J.D. Power, told reporters at a briefing in Detroit. The quality gap between the foreign imports and the Detroit auto makers is now the smallest it has ever been, David Sargent, JD Power’s vice president of automotive research, said during a speech at the Automotive Press Association in Detroit. The domestics lagged behind the foreign auto makers by just six points.

    The 2009 Initial Quality Study (IQS) provides information gathered from over 80,000 purchasers and lessees of 2009 model-year vehicles. Performance is measured using a “problems per 100 vehicles (PP100)” metric. A lower PP100 score indicates better performance and a higher PP100 score indicates worse performance. The 2009 study covers a total of 228 total problems, and organizes them into the following eight categories:

    • Exterior
    • The Driving Experience
    • Features/Controls/Displays
    • Audio/Entertainment/Navigation
    • Seats
    • HVAC, or Climate Controls
    • Interior
    • Engine/Transmission

    The highlights of the 2009 IQS study (courtesy of J.D. Power & Associates):

    • Overall, the industry average for initial quality is 108 problems per 100 vehicles (PP100) in 2009, down from 118 PP100 in 2008. Initial quality for domestic brands has improved to an average of 112 PP100 in 2009 from 124 PP100 in 2008, while import brands have improved to an average of 106 PP100 in 2009 from 114 PP100 in 2008.
    • Lexus leads the overall nameplate rankings, averaging 84 PP100. This is the 12th time Lexus has been the highest-ranked brand in the 20 years it has been included in the IQS and the first time since 2005.
    • Following in the rankings are PorscheCadillac (which moves from 10th rank position in 2008 to third in 2009),Hyundai (improves from 13th rank position in 2008 to fourth in 2009) and Honda, rounding out the top five.
    • Toyota Motor Corporation captures 10 segment awards—more than any other automaker in the 2009 study—including five for Lexus, four for Toyota and one forScion. Lexus receives awards for the ISGSGXLSand LX models. The Lexus LX has the fewest quality problems in the industry, with just 52 PP100. Toyota models receiving awards in their respective segments are the 4Runner (in a tie); SiennaTundra (in a tie); andYaris.
    • Ford receives three awards for the Edge (in a tie); F-150 (in a tie); and Mustang. Garnering two awards each are Nissan (Altima and Z); and Honda (CR-V, in a tie, and Ridgeline).
    • Also receiving segment awards are: Chevrolet TrailBlazer (in a tie), Chrysler PT Cruiser (in a tie), GMC YukonHyundai Elantra SedanMercury Sable and Scion tC.
    • Suzuki is the most-improved nameplate in the industry this year. A reduction of 49 PP100 moves the Japanese brand from 32nd place in 2008 to ninth place this year. Suzuki is also the most improved nameplate for both Defects/Malfunctions and Design-related problems. Also, Saturn improves by 37 PP100 and Jeep by 30 PP100.
    • The Toyota Motor Corporation assembly plant in Higashi-Fuji, Japan, receives the Platinum Plant Quality Award for producing vehicles yielding the fewest defects and malfunctions. Averaging just 29 PP100, the plant produces the Lexus SC 430 and Toyota Corolla. (Plant awards are based solely on average levels of defects and malfunctions and exclude design-related problems.)
    • Among North and South American plants, the Honda plant in East Liberty, Ohio, which produces the Civic Sedan, CR-V and Element, achieves the Gold Plant Quality Award.
    • In the Europe and Africa region, Daimler’s East London, South Africa, plant, which produces the Mercedes-Benz C-Class, receives the Gold Plant Quality Award.

    The results underscored the competitive pressure on the industry at a time when U.S. sales have been driven to 30-year lows and both GM and Chrysler have been forced to rely on federal financing to restructure through bankruptcy.

    U.S. automakers have spent heavily in recent years in a bid to close the gap with the Japanese automakers led by Toyota and Honda, which have established a reputation for eliminating flaws from engineering and manufacturing.

    This year, GM’s Cadillac brand is the highest ranked domestic nameplate with 91 problems per 100 vehicles. Cadillac is ranked third and moved up from 10th last year.

    Ford Motor Co. received the second most segment awards of any automaker with top rankings for its redesigned F-150 pickup, Ford Mustang mid-size sports car, Ford Edge crossover and Mercury Sable full-size sedan.

    Brands that do well — typically luxury cars top the list — can use the results to bolster advertising campaigns. The vehicles were evaluated between November through February. “High quality enhances an auto maker’s reputation for reliability which is a critical purchase consideration for many consumers,” Mr. Sargent said.

    Boosted by a strong reception for its high-end Genesis sedan, Hyundai Motor Co (005380.KS) pushed ahead of both Toyota and Honda Motor Co (7267.T) to become the top-ranked mass-market auto brand and No. 4 overall.

    Honda ranked No. 5, followed by Mercedes-Benz, Toyota, Ford and GM’s Chevrolet.

    Click here to read the entire 2009 Initial Quality Study Results.