Publication Alert: Aviation and Marine Transportation: GHG Mitigation Potential and Challenges

January 4, 2010 at 5:20 pm

(Source: The Pew Center on Global Climate Change)

Click the image to access a summery of the report

I came across this excellent report, Aviation and Marine Transportation: GHG Mitigation Potential and Challenges, via an article on Washington Post and felt compelled to share with you all.   This report published by The Pew Center on Global Climate Change examines growth projections for emissions from both aviation and marine transportation and options to reduce those emissions.  Aviation and marine transportation combined are responsible for approximately 5 percent of total GHG emissions in the United States and 3 percent globally and are among the fastest growing modes in the transportation sector. Under business-as-usual forecasts, CO2 emissions from global aviation are estimated to grow 3.1 percent per year over the next 40 years, resulting in a 300 percent increase in emissions by 2050.International marine transportation emissions are estimated to grow by 1 to 2 percent per year, increasing by at least 50 percent over 2007 levels by 2050. Controlling the growth in aviation and marine transportation GHG emissions will be an important part of reducing emissions from the transportation sector.

According to the press release, the report explores a  range of near-, medium- and long-term mitigation options that are available to slow the growth of energy consumption and GHG emissions from aviation and marine shipping. These options include improvements in operational efficiency, improvements in the energy efficiency of engines and the design of air and marine vessels, and transitioning to less carbon-intensive fuels and transportation modes. Implementation of these options could result in reductions of more than 50 percent below BAU levels by 2050 from global aviation and more than 60 percent for global marine shipping. For these reductions to be realized, however, international and domestic policy intervention is required. Developing an effective path forward that facilitates the adoption of meaningful policies remains both a challenge and an opportunity.

“Aviation and marine shipping are two of the fastest growing modes of transportation,” said Eileen Claussen, President of the Pew Center on Global Climate Change.  “Their greenhouse gas emissions are growing rapidly as well. To protect the climate, we need to reduce emissions across the entire economy. Aviation and marine shipping are part of the climate problem, and this report shows that they can be part of the solution.”

Aviation and Marine Transportation: GHG Mitigation Potential and Challenges also examines policy options for achieving reductions in GHG emissions from these transportation modes. The paper, authored by David McCollum and Gregory Gould of the University of California at Davis and David Greene from Oak Ridge National Laboratory, explains the challenges, examines policy efforts to date, and explores both domestic and international policy options for addressing emissions from aviation and marine transportation.

Key sections of the paper include:

  • An introduction to aviation and marine transportation and a discussion of the determinants of their GHG emissions;
  • An overview of current emissions trends and growth projections;
  • An explanation of the technological mitigation options and potential GHG emission reductions; and
  • Policy options at both the domestic and international level to achieve deep and durable reductions in emissions.

Click here to access the Pew Center’s website or click here to download the entire PDF report.

China’s unveils the world’s fastest train link; Electrified network surpasses 30,000 kms, earning # 2 spot in the world

December 26, 2009 at 1:08 pm

(Sources: AFP via Yahoo; Xinhua, Times of India)

China on Saturday (Dec 26) unveiled what it billed as the fastest rail link in the world — a train connecting the modern cities ofGuangzhou and Wuhan at an average speed of 350 kilometres (217 miles) an hour.

The super-high-speed train reduces the 1,069 kilometre journey to a three hour ride and cuts the previous journey time by more than seven and a half hours, the official Xinhua news agency said. Work on the project began in 2005 as part of plans to expand a high-speed network aimed at eventually linking Guangzhou, a business hub in southern China near Hong Kong, with the capital Beijing, Xinhua added.

The train can go 394.2 kilometres per hour, it’s the fastest train in operation in the world,” Zhang Shuguang, head of the transport bureau at the railways ministry, told Xinhua. By comparison, the average for high-speed trains in Japan was 243 kilometres per hour while in France it was 277 kilometres per hour, said Xu Fangliang, general engineer in charge of designing the link, according to Xinhua.

Test runs for the service began earlier in December and the link officially went into service when the first scheduled train left the eastern metropolis of Wuhan on Saturday.

To sweeten the news further, a report published on the Xinhua quoted the China CREC Railway Electrification Bureau Group (CCREBG) stating that China’s electrified railway mileage has surpassed 30,000 kilometers, ranking the second in the world, said.

It achieved the goal with the completion of a 1,422.2-kilometer electrified railway line which connects Beijing and Lehua in south China’s Jiangxi Province on Saturday, according to the CCREBG. The project, involving an investment of more than 7.6 billion yuan (or1.112 billion U.S. dollars), will increase the trains’ speed from 120 kilometers to 160 kilometers per hour and raise the transportation volume from 3,500 tonnes to 6,000 tonnes by each train. Congratulations, China.

The era of high speed railway began in China in 2004 when Guangzhou was linked to Shenzhen, both in Guangdong Province, with a train traveling at 160 km per hour. This was followed by the launch of a high-speed line linking the capital with the port city of Tianjin at the time of the 2008 Beijing Olympics.

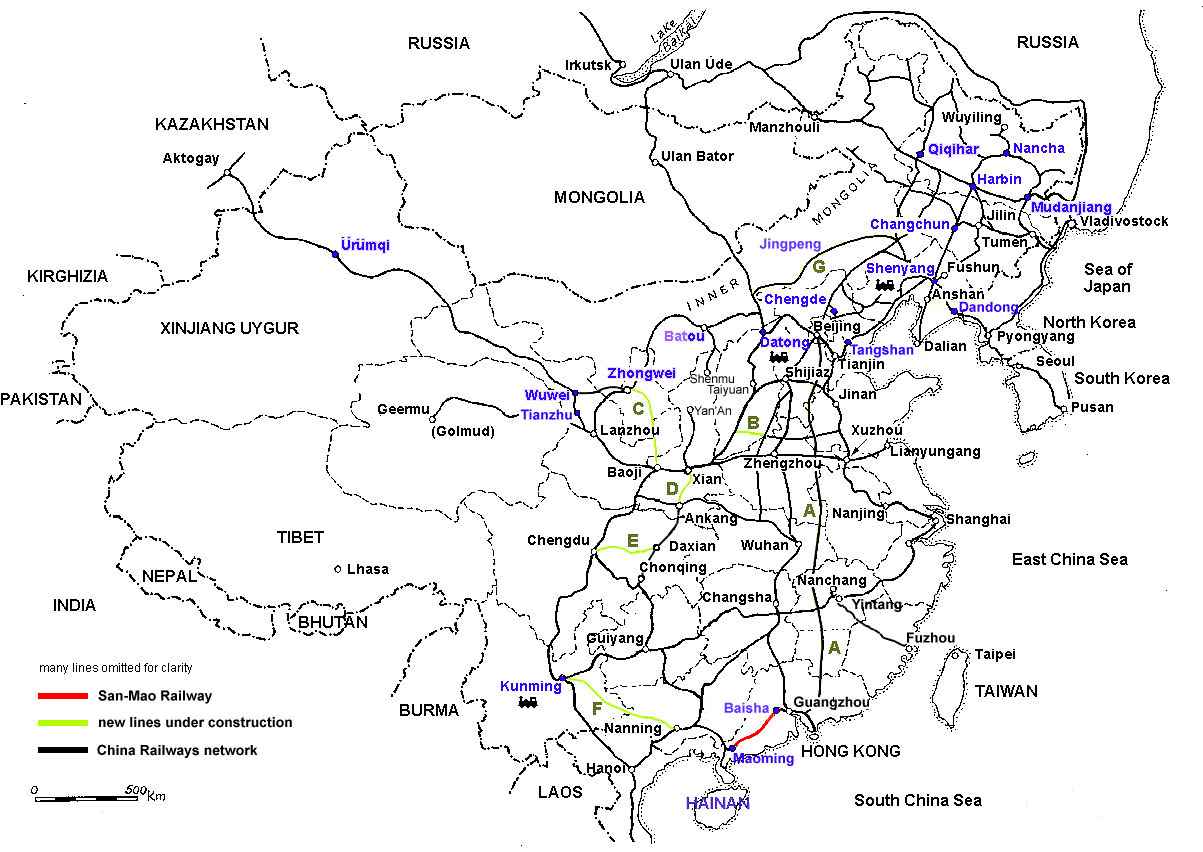
The government recently announced it plans to build 42 high-speed lines by 2012 in order to spur economic growth amid the global downturn. China has unveiled a massive rail development program, considered to be the world’s biggest plan outside the United States. The goal is to take the rail network from the current 86,000 kilometers to 120,000 kilometers.

Rage against the machine – Seething Brits lambast Eurostar poor crisis management; Rail service halted indefinitely

December 21, 2009 at 12:44 pm

(Source: Huffington Post; The Independent)

The only passenger rail link between Britain and the rest of Europe has been shut down indefinitely, Eurostar said Sunday, promising more travel misery for thousands of stranded passengers just before Christmas.

Services have been suspended since late Friday, when a series of glitches stranded five trains inside the Channel Tunnel and trapped more than 2,000 passengers for hours in stuffy and claustrophobic conditions. More than 55,000 passengers overall have been affected.

A Bloomberg news report says Eurostar Group Ltd., operator of high-speed trains through the Channel Tunnel will resume a limited service tomorrow after its trains stopped working in snowy weather, causing three days of cancellations.

The disruption will prove “very expensive,” Eurostar said today at a briefing in Paris, while declining to give an estimate of the likely cost.

Some panicked passengers stayed underground for more than 15 hours without food or water, or any clear idea of what was going on – prompting outrage from travelers and a promise from Eurostar that no passenger train would enter the tunnel until the issue had been identified and fixed.

Eurostar runs services between England, France and Belgium. The company said Sunday it had traced the problem to “acute weather conditions in northern France,” which has seen its worst winter weather in years.  The company noted that its problem with the trains this weekend has been to do with the changes between the sub-zero temperatures outside the tunnel and the 25C (77F) heat within the tunnel.

The breakdown was probably caused after cold air sucked through intakes on the locomotives was quickly warmed on entry to the tunnel, resulting in condensation that shorted out electrical circuits, Eurostar has said.

The problem represents a “new mode of failure” not encountered before in Eurostar’s 15-year history, Brown said. After 15 years of comparatively trouble-free operations, high-speed train company Eurostar is now facing huge challenges.  There have been numerous cold snaps in that time, with the trains running from London through Kent – one of the UK’s snowiest counties.

The company’s bosses must get to the bottom of a cold weather malfunction of trains that appears baffling – even to rail experts.

And they must then win back the trust of the travelling public -a trust which will have been eroded by all the tales of travel misery that emerged this weekend after the train failures within the Channel Tunnel.

Eurostar has suffered two serious in-tunnel fires during its 15-years of operation. But despite those setbacks it has become the way to travel between London and Paris and Brussels.

Already popular, the service was given a further boost when the 68-mile London to Folkestone Channel Tunnel high-speed rail link – now known as HS1 – was completed in 2007.

This enabled passengers to travel to Paris from London in two hours 15 minutes, while London-Brussels journey times came down to one hour 51 minutes.

China strengthens transportation infrastructure muscle, again; Starts construction of world’s longest sea bridge (37.6 kms)

December 16, 2009 at 7:52 pm

(Sources:  The Guardian, UK, New Civil Engineer)

China today announced it had begun construction of the world’s longest sea bridge – barely 18 months after opening the current record-holder.

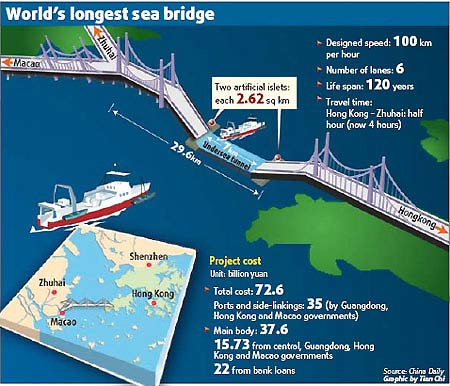
The Y-shaped link between Hong Kong, Macau and China will be around 50km (31 miles) long in total, 35km of which will span the sea, said the state news agency Xinhua. Due to be completed by 2015, the 73bn yuan (£6.75bn) cost of the bridge will be shared by the authorities in the three territories.

Here are some interesting design features of this project as noted on the Hong Kong Government’s Highways Department website:  The HZMB Main Bridge is a 29.6km dual 3-lane carriageway in the form of bridge-cum-tunnel structure comprising an immersed tunnel of about 6.7 km. According to the current option, It runs from the artificial island off Gongbei of Zhuhai to the eastern artificial island for the tunnel section just west of the HKSAR boundary.

The Highways department website notes that this project includes construction of a 29.6 km dual three-lane carriageway in the form of bridge-cum-tunnel structure comprising a tunnel of about 6.7 km and the construction of two artificial islands for the tunnel landings west of the HKSAR boundary

The structure also includes a 5.5km underwater tunnel with artificial islands to join it to bridges on each side. According to the engineering group Arup – which has helped with the design – it is the first major marine bridge-and-tunnel project in China. But the engineering firm described the structure as 38km in length; the reason for the disparity in the bridge length was unclear.

Work is expected to begin with land reclamation to create an artificial island of around 216 hectares (540 acres) off Zhuhai. This will become the customs point for those making the crossing.

But much of the structure will be prefabricated offsite, so, for example, the concrete deck sections can be produced at the same time as the foundations are laid. The tunnel will be made of precast sections – each 100 metres long.

“It is designed with a service life of 120 years. It can withstand the impact of a strong wind with a speed of 51 meters a second, or equal to a maximum Beaufort scale 16 (184 to 201kmph),” said Zhu Yongling, an official in charge of the project construction. “It can also resist the impact of a magnitude-8 earthquake and a 300,000-tonne vessel.”

According to an article in New Civil Engineer magazine earlier this year, the bridges cross three navigation channels while the tunnel goes under a fourth.

“There is an airport nearby, so we could not build a bridge [in that area] which was the reason for the tunnel. The immersed tube is the longest in the world at 5.5km long,” Naeem Hussain, global bridge leader at Arup, told the publication.

He said the bridge’s piers would each be 170 metres high and that the design team had minimised the structures impact on estuary flows by limiting the size and number of columns in the water.

The project has been on the drawing board for some time after first being discussed by politicians in the 1980s. The Hong Kong-Zhuhai-Macau Bridge (HZMB) Advance Work Coordination Group was established in 2003 and the China’s Central Government and the regional governments of Guangdong, Hong Kong and Macau agreed finance last summer. “The idea of having a bridge came more than 20 years ago around 1983 and came from a local tycoon named Sir Gordon Wu,” says Arup director Daman Lee.

Creating the two islands where the tunnel dives under the sea involves a considerable land reclamation work. “The border crossing facility in Hong Kong will have to be created from scratch as a reclaimed island,” said Lee. “It’s 120ha so it’s quite a big place. A car would come in from Zhuhai, go through customs and then onto Hong Kong. Or it would park there and public transport would be used. Macau is too small to allow for car traffic so all cars [from Hong Kong and China will have to] park [at the border crossing] and take public transport”.

The Hong Kong Government’s Highways Department website offers some interesting estimates about the traffic volume projections for this new sea link and offers this strategic outlook from an economic standpoint: The HZMB will be strategically important to the further economic development of Hong Kong, Macao and the Western Pearl River Delta region. It will significantly reduce transportation costs and time for travelers and goods on the road, but the benefits go far beyond this. With the HZMB, the Western PRD will fall within a reachable three-hour commuting radius of Hong Kong. This would enhance the attractiveness of the Western PRD to external investment, which is conducive to the upgrading of its industry structure. Hong Kong will benefit from this new economic hinterland, with its vast human and land resources which will provide ample opportunities for Hong Kong businessmen to expand their operation in the Mainland.

The Economic Net Present Value (ENPV) of the project is about RMB¥40 billion for an operation period of 20 years. The estimated ENPV for Hong Kong is about RMB¥23 billion as compared to RMB¥13 billion for the Mainland and RMB¥4 billion for Macao. The Economic Internal Rate of Return of the project is 8.8% in respect of Hong Kong over a 20-year period, or 12% over a 40-year period.

Click here to read the entire Guardian article. Also, do not hesitate to visit the Wiki page for this project, which offers far more information than any other source on the web, covering a whole slew of project information, assembled from various sources.

Call for Abstracts – ITS Canada Annual Conference and General Meeting

December 8, 2009 at 12:26 am

ITS Canada Annual Conference and General Meeting 2010
June 13 to 16, 2010 ~ Ottawa, Ontario

ITS Canada is now organizing its 2010 Annual Conference and General Meeting, to be held in Ottawa from June 13-16, 2010, at the Crowne Plaza Ottawa Hotel.Logo

The overall Conference theme is “ITS: For Efficient, Safe and Clean Transport”, recognizing the important role that intelligent transportation plays in moving people and goods safely and efficiently, with minimum environmental impact. With your help, we can build a robust and exciting technical program! The “Call for Abstracts” is attached. Please consider presenting to your peers at this prestigious event.  Included in the event will be an exhibit area to allow displays of ITS-related technologies and services, as well as technical tours and exciting social events. ITS Canada welcomes papers and presentations on how ITS can address the issues of efficient, safe and clean transport. Some suggested topic areas (not intended to be exhaustive) are:

o Changes to our operations and business models as the Networked Vehicle, IntelliDriveSM
and intelligent vehicle tracking roll out
o Integration of ITS solutions across regional areas and across modes and functions
o Moving from research to products and services
o Emerging technologies
o The role of ITS in clean and sustainable transportation
o Realignment of roles between the public and private sector
o Recent application of innovative ITS solutions.
Important Dates:
Abstract Due: January 29, 2010
Notice of Abstract Acceptance: March 11, 2010
Conference Registration Discounts End: April 16, 2010
Papers/Presentation Material Due: May 28, 2010
Conference Presentation: June 13-16, 2010
Abstract Submission:
Please submit an abstract for your paper or presentation, no longer than one page, in electronic
file format (either in PDF or Microsoft WORD format), to:
Stephen Erwin, P.Eng.
Chair, Technical Program Committee
ITS Canada 2010 Annual Conference and General Meeting
Ministry of Transportation of Ontario
3rd Floor, Building B, 1201 Wilson Avenue, Downsview, ON Canada M3M 1J8
Tel (416) 235-4676 ~ Fax (416) 235-6669 ~ stephen.erwin@ontario.ca
All presenters are required to register.
Watch for Conference updates and registration information: www.itscanada.ca/ottawa2010
  • Changes to our operations and business models as the Networked Vehicle, IntelliDriveSM and intelligent vehicle tracking roll out
  • Integration of ITS solutions across regional areas and across modes and functions
  • Moving from research to products and services
  • Emerging technologies
  • The role of ITS in clean and sustainable transportation
  • Realignment of roles between the public and private sector
  • Recent application of innovative ITS solutions.

Important Dates:

  • Abstract Due: January 29, 2010
  • Notice of Abstract Acceptance: March 11, 2010
  • Conference Registration Discounts End: April 16, 2010
  • Papers/Presentation Material Due: May 28, 2010
  • Conference Presentation: June 13-16, 2010

Abstract Submission:

Please submit an abstract for your paper or presentation, no longer than one page, in electronic file format (either in PDF or Microsoft WORD format), to:

Stephen Erwin, P.Eng.
Chair, Technical Program Committee
ITS Canada 2010 Annual Conference and General Meeting
Ministry of Transportation of Ontario
3rd Floor, Building B, 1201 Wilson Avenue, Downsview, ON Canada M3M 1J8
Tel (416) 235-4676 ~ Fax (416) 235-6669 ~ stephen.erwin@ontario.ca

All presenters are required to register.

ITS Canada is pleased to invite you to come and enjoy the best in Ottawa hospitality while learning about the latest updates on ITS developments in Canada and around the world. Visit the Conference website at www.itscanada.ca/ottawa2010 for timely updates regarding all events.

Click here to read/print the PDF version of call for abstracts.

FHWA’s Transportation and Climate Change Newsletter – October 2009

December 8, 2009 at 12:03 am

(Source: Office of Planning, Environment and Realty – Federal Highway Administration)

Recent Events

U.S. DOE and U.S. EPA announce the 2010 Fuel Economy Guide for model year 2010 vehicles. Each vehicle listing gives an estimated annual fuel cost, based on the vehicle’s MPG rating and national estimates for annual mileage and fuel prices. The online version of the guide allows consumers to input their local gasoline prices and typical driving habits to receive a personalized fuel cost estimate. Fuel efficiency is important for reducing CO2 and other GHGs. The top ten fuel economy leaders for 2010 include nine hybrid vehicles, from compact cars to SUVs.

World Resources Institute issues provisional GHG emissions reporting standard for public sector. The standard was developed in consultation with agencies from all levels of government and is supported by the Federal Energy Management Program within U.S. DOE and U.S. EPA. The standard includes guidance on how to apply GHG accounting principles to government operations at the federal, state and local level. The standard is compatible with the Local Government Operations Protocol recently adopted by The Climate Registry, ICLEI Local Governments for Sustainability (ICLEI), the California Air Resources Board (CARB) and California Climate Action Registry (CCAR). For questions or to submit comments on the standard, please email Stephen Russell or Mary Sotos at pspcomments@wri.org.

EESI publishes State Actions on Climate Change: A Focus on How Our Communities Grow, to encourage State, regional, and local governments to focus on land use reform as a key strategy for reducing GHG emissions. The publication is the result of collaboration with the American Planning Association to develop tools to assist planners. The study examined State and regional climate action plans for their inclusion of transportation, green building, and land use or “smart growth” practices and found that the plans cover a broad range of strategies, because each area has unique geographic and socioeconomic conditions. Of the three, transportation practices were the dominant feature, along with, to a lesser degree, green building policies. Some common transportation policies include adopting California’s vehicle emissions standard (the country’s most aggressive standard), creating more mass transit options, and providing incentives to lower VMT. Specific smart growth practices appeared to be the least likely component of the plans. A table at the end of the document shows some aspects of urban planning that are incorporated. Any GHG reduction targets adopted or regional climate action plans to which a state belongs are provided.

Simple Measures Can Yield Big GHG Cuts, Scientists Say in Proceedings of the National Academy of Sciences. Dr. Thomas Dietz, Michigan State University assistant vice president for environmental research, and his colleagues find that simple, voluntary activities such as routine vehicle maintenance, carpooling and trip chaining, eco-driving, and use of low-rolling-resistance tires can result in significant reductions in GHG emissions and, therefore, “deserve increased policy attention.” They examined 17 household action types in five behavioral categories. Adoption of these actions typically is the result of several policy tools and strong social marketing, the authors state. They estimate that if the behaviors became the norm across the nation it could save 123 million metric tons of carbon per year, equal to 7.4% of U.S. national emissions, within ten years with little or no reduction in household well-being. Their estimates are based on “how many families could reasonably be expected to take such measures if they were provided information, offered financial assistance and could interact with others doing so.”

Managing Our Coastal Zone in a Changing Climate: The Time to Act is Now Issued by the Parliament of the Commonwealth of Australia Provides Insights Relevant to U.S. The fact that many Australian coastal communities have single-access roads is an issue of grave concern to the Commonwealth. The report noted that evacuation routes were a significant factor in the extent of a July 2009 bushfire tragedy (“Black Saturday”). Dr. John Church, from [the Commonwealth Scientific and Industrial Research Organisation, Australia’s national science agency] pointed out that “sea-level-rise planning benchmarks need to be part of a risk management framework,” stating “We really have to move into a risk assessment framework…where we talk more about probabilities and the risks that we are prepared to take….One problem that we have is that planners tend to come to us and say, “How much do we need to allow for sea level rise?’ The retort I always give is, ‘What kind of risks do you want to take?’ I think this is a very important change in process that we need: to put the onus of the risk back onto the planners and the policymakers, not leave it to the scientists.’

State and Local News

Draft Pennsylvania Climate Action Plan released for comment. The plan contains 52 climate policy actions, which are estimated to reduce the Commonwealth’s GHG emissions by 95.6 million metric tons (a 36 percent reduction below year 2000 business-as-usual levels, 42% if recent state and federal actions are included) and to provide a net gain of $5.13 billion and 54,000 new jobs by 2020. The Plan does not address climate change adaptation. The GHG emissions inventory and projections, which cover 1990 to 2020, use “standardized methodology prescribed by the [EPA] and in accordance with international standards.” Transportation is the third largest source of GHG emissions in Pennsylvania (24% in 2000, of which gasoline-powered on-road vehicles accounted for about 64% and on-road diesel vehicles for 15%). Of all the sectors analyzed, GHG mitigation actions from transit and ground passenger transportation are projected to produce the second largest financial gain for the Commonwealth. The Land Use and Transportation work plan recommendations are listed in the following table.

Land Use and Transportation (LUT) Work Plan Recommendations
Work Plan No. Work Plan Name Annual Results (2020) Cumulative Results (2009-2020) CCAC Voting Results (yes/No / Abstained)1
GHG Reductions (MMtCO2e Costs (Million $) Cost Effectiveness ($/tCO2e) GHG Reductions (MMtCO2e Costs (NPV, Million $) Cost Effectiveness ($/tCO2e)
3 Low-Rolling-Resistance Tires .68 -$212 -$310 4.1 -$1,244 -$300 16/5/0
5 Eco-Driving PAYD .43 -$277 -$651 1.76 -$1,065 -$605 13/8/0
Feebates .41 -$133 -$320 2.74 -$810 -$296 13/8/0
Driver Training .62 -$129 -$206 4.53 -$605 -$134 13/8/0
Tire Inflation .09 -$27 -$282 0.58 -$137 -$238 13/8/0
Speed Reduction 1.96 $185 $94 23.0 $4,153 $181 13/8/0
6 Utilizing Existing Public Transportation Systems .05 $300 $6.000 0.55 $3,000 $5,454 13/8/0
7 Increasing Participation in Efficient Passneger Transit .12 <$0 <$0 2.02 <$0 <$0 21/0/0
8 Cutting Emissions From Freight Transportation .99 -$293 -$295 6.67 -$1,495 -$224 15/6/0
9 Increasing Federal Support for Efficient Transit and Freight Trasport in PA 1.17 $92 $78 12.87 $1.0082 $78 20/1/0
10 Enhanced Support for Existing Smart Growth/Trasportation and Land-Use Policies .76-1.84 <$0 <$0 3.79-9.18 <$0 <$0 13/8/0
11 Trasit-Oriented Design, Smart Growth Communities, & Land-Use Solutions Included in T-10 <$0 <$0 Included in T-10 <$0 <$0 13/8/0
Sector Total After Adjusting for Overlaps 6.6 -$494 -$75 60.1 $2,805 $47
Reductions From Recent State and Federal Actions 15.7 -$1093 -$313 72.0 -$3803 -$253
1 Pennsylvania Clean Vehicles (PCV) Progarm 0.095 0.0 0.0 1.27 0.0 0.0 NA
Federal Vehicle GHG Emissions and CAFE Standards 12.2 NQ NQ 57.3 NQ NQ NA
2 Bofuel Developemnt and In-State Production Incentive Act 3.47 -$89 -$26 14.8 -$203 -$14 NA
4 Diesel Anti-Idling Program 0.07 -$20 -$273 0.7 -$177 -$238 NA
Sector Total Plus Recent Actions 22.3 -$603 -$27 132 $2,425 $18

1NA in this column means “not applicable.” Work plan numbers 1,2, and 4 are recent state actions that are being implemented by the state; and the federal government will be implementing national vehicle GHG emissions and corporate average fuel economy (CAFE) standards starting in 2012.
2Because T-9 uses federal dollars exclusively, it should be noted that the cost figures for T-9 are calculations of how many federal dollars – not state dollars – would be required to implement the work plan.
3This cost per ton value excludes the emission reductions associated with the “Federal Vehicle GHG Emissions and CAFE Standards” since costs (savings) were not quantified for this recent federal action.
GHG = greenhouse gas; MMtCO2e = million metrice tons of carbon dioxide equivalent; $/tCO2e = dollars per metric ton of carbon dioxide equivalent; NPV = net present value; NQ = not quantified; PA = Pennsylvania; PAYD = Pay-As-You-Drive; CAFE = Corporate Average Fuel Economy.

Climate Change and Transportation in Maine published by MaineDOT. This white paper prepares MaineDOT to respond to the Governor’s call to evaluate climate change adaptation options and positions the agency to work with transportation stakeholders to evaluate short-term and long-term approaches to preparing for and adapting to climate change. Judy Gates, Director of MaineDOT’s Environmental Office said “…uncertainty [about long-range impacts due to climate change] can create paralysis in an agency charged with making and justifying long-term, fiscally-responsible decisions around the safety and efficiency of public travel. But the long life-cycles of most transportation infrastructure demand early preparation to protect significant tax payer investments…” The white paper includes a table showing how Maine’s current and proposed adaptation strategies compare to seven other States whose Climate Action Plans address adaptation (see below). The paper references the part of TRB’s Special Report 290: Potential Impacts of Climate Change on U.S. Transportation that discusses the Caltrans process of evaluating bridges for seismic retrofitting, in which TRB suggests that a similar approach could be used to screen and identify critical infrastructure that is vulnerable to the impacts of climate change. MaineDOT has already included climate change as a factor to be considered in future planning with an eye towards conducting technical, risk-based assessments such as California’s.

Adaptation Strategies States have Recommended
RECOMMENDED STRATEGY AK CA FL MD OR VT WA ME
Monitor the changing environment X X X X X X X X
Assess infrastructure’s resiliency to climate change impacts X X X X X X
Cost/benefit or risk based analysis of retrofitting/replacing vulnerable infrastructure X X X
Incorporate climate change into current and future planning X X X X X X X X
Reduce stress on threatened and endangered species X X X
Design/build infrastructure to withstand climate change impacts X X X X X X
Maintain/restore habitat connectivity and/or natural barriers to sea level rise X X X X

Announcements

Behavior, Energy and Climate Change Conference in DC, November 16-18, has webcast option. The webcast costs $150 for one day or $300 for all three days, versus $320 and $600, respectively, for on-site attendance. The webcast option is limited to 200 people who register by November 12.The conference is sponsored by the American Council for an Energy-Efficient Economy, Stanford University’s Precourt Energy Efficiency Center, and the California Institute for Energy and Environment.

TRB announces webinar: A Transportation Research Program for Mitigating and Adapting to Climate Change and Conserving Energy. This web briefing on December 2, from 2:00-3:00 p.m. EST will explore the findings of TRB’s Special Report 299: A Transportation Research Program for Mitigating and Adapting to Climate Change and Conserving Energy.Participants must register at least 24 hours in advance, space is limited, and there is a fee for non-TRB-Sponsor employees. To learn more about current and planned FHWA research on climate change mitigation and adaptation, visithttp://www.fhwa.dot.gov/hep/climate/index.htm.

FYI

What is the United Nations Framework Convention on Climate Change (UNFCCC), the Convention? The Convention is an international treaty adopted in 1992 in Rio de Janeiro and ratified by almost all of the countries of the world, in which they agreed to undertake policies and measures to return their greenhouse gas emissions to 1990 levels by 2000. In 1997, all but two of the Convention signatories (the U.S. and Turkey) adopted an addition to the Convention, the Kyoto Protocol, which has specific binding GHG emission targets to be achieved in the 2008 – 2012 time period (which would have been 7% for the U.S.) The U.S. has not ratified the Protocol primarily because China and India are exempt from a numerical cap on their emissions. Below are data from the UNFCCC on trends in GHG emissions in industrialized countries (called Annex I Parties) that committed to voluntary GHG reductions under the Convention

Table showing 1990-2006 trends for Annex I Parties to the United Nations Framework Convention. Click on the image to display tabular data

Bar Chart showing GHG emission trends in major signatories to the Convention 1990-2007 (including Land Use, Land-Use Change, and Forestry) Click on the image to display tabular data

Related news. Indian Environment and Forest Minister Jairam Ramesh and Chinese Minister for National Development and Reforms Xie Zhenhua signed a 5-year commitment for their countries to collaborate on GHG emission reduction programs, projects, technology development, and demonstration. The Ministers agreed to work together to protect and promote the interests of developing countries like China and India.

Next month:What is “cap and trade” GHG emissions trading, which is in the media so much lately?

USDOT Awards Funds to Dallas, San Diego for New Technology Initiative to Fight Congestion

December 7, 2009 at 3:50 pm

(Source: USDOT Press Release)

Dallas and San Diego selected as Integrated Corridor Management Pioneer Demonstration Sites

In an historic step towards ending gridlock in urban areas across the country, the U.S. Department of Transportation today announced that the Dallas and San Diego areas will receive $14 million as the nation’s first demonstration sites for new Intelligent Transportation System (ITS) technologies that help fight congestion and enhance travel.  The Integrated Corridor Management (ICM) initiative will help the Dallas and San Diego metro areas become “living laboratories” in the fight against congestion.

“These communities are leading the way by using state-of-the-art technologies to create a commute that is safer, less congested and more convenient.” said U.S. Transportation Secretary Ray LaHood.  “America can’t simply build our way to a more modern and efficient transportation infrastructure.  These projects will show the rest of the nation that bumper-to-bumper traffic doesn’t have to be the status quo.”

Dallas Area Rapid Transit (DART) will contribute $3 million for an $8.3 million project. DART will use a transportation management model to predict travel conditions 30 minutes into the future, allowing diversion of traffic to other routes during freeway incidents and special events along US-75.  Travelers will have access to real-time information about traffic, public transit and expected travel times, through wireless and web-based alerts.

The San Diego Association of Governments and its partnering agencies will contribute $2.2 million for a $10.9 million project.  San Diego will use ITS investments along I-15 to enable a “smart” traffic management system that combines road sensors, video and traveler information to take steps to reduce congestion.  It will deliver information to commuters via the internet and message signs and will enable managers to adjust traffic signals and ramp meters to direct travelers to HOV lanes, HOT lanes, bus rapid transit and other options.

Since 2005, ICM has laid the groundwork for transportation agencies to use existing roads, intersections and other elements of urban transportation networks more efficiently

The demonstrations will build on past findings about ICM to provide a first-hand evaluation of the real-world impact.  The new technology will avoid the dangers of text-messaging and other distractions behind the wheel that result in distracted driving.

The initiative is jointly sponsored by the Federal Highway Administration (FHWA), the Federal Transit Administration (FTA), and the Research and Innovative Technology Administration (RITA).

Below is a summary of the ICM Pioneer sites (courtesy of the ITS JPO):

Skyline of Dallas, Texas

ICM Pioneer Sites–Dallas, Texas

The Dallas-Fort Worth area is currently populated by 6 million people, and is growing by 1 million every 7 years. Travel demand and congestion in this area continue to grow. Dallas’ US-75 ICM Corridor is the highest volume and most critical transportation corridor in the region. It has major employment centers and while there is no room for expansion of the corridor, it will be impacted by major construction planned in the surrounding area.

Dallas is creating an operational entity responsible for all ICM activities. In this region, transit availability and capacity is being increased, park-and-ride facilities will be improved, and intelligent transportation system elements are being deployed in the field. In addition, HOV and HOT lanes will be added, and value-pricing strategies are being explored.

The Dallas US-75 ICM corridor was chosen as a site for Analysis, Modeling and Simulation (AMS) of ICM strategies. Click here to learn more about this site’s Experimental Plans and early results.

More on Dallas-Fort Worth, Texas’ ICM Corridor:

The Dallas, Texas application proposed U.S. route 75 from downtown Dallas to SH 121 with the North Dallas Toll Way to the west and DART and various arterials to the east as their corridor. The Dallas Area Rapid Transit Authority was the lead agency, accompanied by the City of Dallas, the City of Richardson, the City of Plano, the City of University Park, the Town of Highland Park, the North Central Texas Council of Governments, the North Texas Tollway Authority, and the TxDOT Dallas District. In addition to the expected freeway and arterial capabilities, the corridor includes HOV, tolling, express bus, and light rail.

ICM Pioneer Sites–San Diego, CaliforniaSkyline of San Diego, California

San Diego experiences significant traffic congestion during peak travel periods, has limited HOV and HOT lanes, and has limited transit capacity. The strong consortium of partnering agencies in San Diego is increasing multi-jurisdictional and multi-agency collaboration on corridor management. Together, they are introducing dynamic ramp metering to reduce arterial spillover and they are looking to collect arterial data to support efficient signal timing strategies. This ICM team is implementing dynamic variable pricing along 21 miles of managed lanes and pioneering congestion avoidance awards.

The San Diego I-15 ICM corridor was chosen as a site for Analysis, Modeling and Simulation (AMS) of ICM strategies. Check back in late 2009 for updates on this site’s Experimental Plans and early results.

More on San Diego, California’s ICM Corridor:

The San Diego, California application proposed I-15 from SR 52 in San Diego to SR 78 in Escondido as their corridor. The San Diego Association of Governments (SANDAG) was the lead agency, accompanied by Caltrans, the City of San Diego, the City of Escondido, the City of Poway, the Metropolitan Transit System, and the North County Transit District. In addition to the expected freeway and arterial capabilities, the corridor includes HOV, tolling, value pricing, express bus, and BRT.

Click here to read more.

Lost and Found! Runaway school boy rides NYC subways for 11 days fearing scolding at home

November 24, 2009 at 1:14 pm

(Source: New York Times)

Day after day, night after night, Francisco Hernandez Jr. rode the subway. He had a MetroCard, $10 in his pocket and a book bag on his lap. As the human tide flowed and ebbed around him, he sat impassively, a gangly 13-year-old boy in glasses and a redAfter getting in trouble in class in Bensonhurst, Brooklyn, and fearing another scolding at home, he had sought refuge in the subway system. He removed the battery from his cellphone. “I didn’t want anyone to scream at me,” he said.

All told, Francisco disappeared for 11 days last month — a stretch he spent entirely in subway stations and on trains, he says, hurtling through four boroughs. And somehow he went undetected, despite a round-the-clock search by his panicked parents, relatives and family friends, the police and the Mexican Consulate.

Since Oct. 26, when a transit police officer found him in a Coney Island subway station, no one has been able to fully explain how a boy could vanish for so long in a busy train system dotted with surveillance cameras and fliers bearing his photograph. hoodie, speaking to no one.

Francisco told the paper that he spent his time on three subway lines, the D, F and 1, and would ride the trains until the last stop then hop on the next one going back the other way.  He ate whatever he could afford from subway newsstands, like potato chips and jellyrolls, then neatly folded the wrappers and saved them in his backpack, while drinking bottled water. He drank bottled water. He used the bathroom in the Stillwell Avenue station in Coney Island.

Otherwise, he says, he slipped into a kind of stupor, sleeping much of the time, his head on his book bag. “At some point I just stopped feeling anything,” he recalled.

Six days after Francisco’s disappearance, on Oct. 21, the case shifted from the police precinct to the Missing Persons Squad, and the search intensified. A police spokeswoman explained that a precinct must complete its preliminary investigation before the squad takes over. The squad’s focus then turned to the subway. Officers blanketed the system with their own signs, rode trains and briefed station attendants.

About 6 a.m. on Oct. 26, the police said, a transit officer stood on the D train platform at the Stillwell Avenue station studying a sign with Francisco’s photo. He turned and spotted a dirty, emaciated boy sitting in a stopped train. “He asked me if I was Francisco,” the boy recalled. “I said yes.”

Asked later how it felt to hear about the work that had gone into finding him, Francisco said he was not sure. “Sometimes I don’t know how I feel,” he said. “I don’t know how I express myself sometimes.”

Apart from leg cramps, he was all right physically, and returned to school a week later. But Ms. García said she was still trying to learn how to manage her son’s condition.

Click here to read the entire story.

Watch out WMATA! Feds get serious about Transit Safety; Propose Federal safety oversight of all Transit systems

November 15, 2009 at 1:03 pm

(Source: Washington Post; Bloomberg)

The Obama administration will propose that the federal government take over safety regulation of the nation’s subway and light-rail systems, responding to what it says is haphazard and ineffective oversight by state agencies.

Under the proposal, the U.S. Department of Transportation would do for transit what it does for airlines and Amtrak: set and enforce federal regulations to ensure that millions of passengers get to their destinations safely. Administration officials said the plan will be presented in coming weeks to Congress, which must approve a change in the law.

The proposal would affect every subway and light-rail system in the country, including large systems in Washington, New York, Boston, Los Angeles and San Francisco.

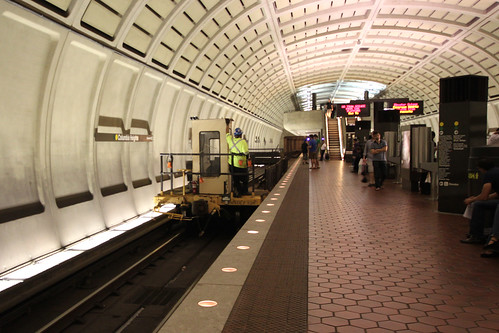
Administration officials said they are responding to a growing number of collisions, derailments and worker fatalities on subways — and in particular to the fatal June 22 crash on Metro’s Red Line and failures in oversight that have surfaced in its wake. Those failures have been the subject of an ongoing investigative series in The Washington Post.

Recent transit accidents in Washington, San Francisco, Boston and Chicago have resulted in more than 200 injuries. Following the Washington Metro crash on June 22 that killed nine, Secretary of Transportation Ray LaHood formed a group to look at safety.

The safety review gained added importance as President Barack Obama has stressed expanding subway use as a way to reduce traffic congestion and the country’s dependence on foreign oil.

In the absence of federal oversight, states created 27 agencies that lack the adequate staff, expertise and money to do their jobs, the transportation official said.

The proposal would let the federal government provide money for employee salaries and benefits, training, certification and travel costs to state agencies able to do safety oversight, according to the document.

The Federal Transit Administration would regulate those systems in states that decide not to accept the federal funding or are determined to be inadequate, according to the question- and-answer document.

Click here to read the entire article.

Pedestrian struck and killed by Secret Service Limousine used for VPOTUS

November 11, 2009 at 5:32 pm

(Source: Washington Post)

Two armored U.S. Secret Service vehicles, including a limousine sometimes used by Vice President Biden, struck and killed a man hours before dawn Wednesday as he was crossing rain-slicked Suitland Parkway near the D.C.-Maryland border, authorities said.

The pedestrian, whose name was withheld by police pending notification of his next of kin, was struck by the limousine and a Chevrolet Suburban at 2:27 a.m. at the intersection of the parkway and Naylor Road, just over the District line in Prince George’s County, according to the Secret Service and U.S. Park Police.

The two vehicles, each driven by a Secret Service employee, had just arrived by military plane at Andrews Air Force Base and were being taken to a storage facility in the District, said Secret Service spokesman Malcolm Wiley. He said they were not carrying any “protectees.”

Biden had used the limousine Tuesday during a visit to Fort Lewis, Wash., and the Suburban also had been part of the vice president’s motorcade during the trip, Wiley said.

The armored sport utility vehicle and limousine were occupied only by Secret Service employees and were not carrying the vice president or any other dignitaries, said Secret Service spokesman Ed Donovan.

Click here to read more.

Transportgooru Musings:  Interestingly, the recent Transportation for America report on Pedestrian Safety ranks Washington, DC somewhere near the middle, among the top 52 cities surveyed, based on the Pedestrian Danger Index