American road traffic fatalities fall to record low since 1950s; Alarming Numbers of Road Traffic Deaths Around The World Remains A Concern

March 11, 2010 at 7:28 pm

(Sources: Next Generation HealthCare via Good; Infrastructurist)

Incidents like 9-11 bring to people’s mind the dangers of man made disasters, and the enormity of the problem gets magnified with the loss of lives resulting from such incidents.  But how many of us realize that here in the US we lose many more lives on our nation’s roads every year due to automobile accidents?  If you have not grasped the enormity of the problem we are facing in our roads, it the rough equivalent of 12 times the losses we suffered in that one incident  — that would be roughly 34,000 lives were lost in the US roads in 2009 alone, according to a new report released by NHTSA. In the decades past the problem was even worse and the transportation agencies at all levels – Federal, State and Local have been actively engaged in combating this problem.  The silver lining in this grey cloud is that the numbers are dropping steadily in the past the years, at least in the US.   Thanks in large part to the continued efforts of the governments in making our roads safer and also to the auto manufacturers who have made the vehicles stronger and smarter, we can now continue to see a reduction in the years ahead.  Here are some interesting numbers from this NHTSA estimates:

  • A decline in highway deaths of  8.9% from 2008 to 2009
  • The lowest fatality rate–1.16 deaths for every 100 million vehicle miles traveled–on record
  • The lowest overall number of deaths–33,963–since 1954
  • 15 straight quarters of decline in the number of overall roadway deaths

Unfortunately, the same cannot be said about the rest of the world.  Pretty much every country on this blue planet has been a victim of this problem and many of them counter massive, tragic losses every year that have only continued to climb up.   The losses are steeper in many of the developing countries and under-developed countries, where the poor infrastructure and lack of enforcement & driver education are compounding the problems.  Especially in countries like China and India, where the growing economies have fueled a significant spike in the number of vehicles on road, the governments are struggling to keep pace with the surging demand for roads and other surface transportation infrastructure. The graphical depiction below, courtesy of  Next Generation Healthcare, clearly demonstrates the enormous problem we are facing around the world.  It shows how many deaths there are from road traffic accidents in different parts of the world and the numbers are alarming.

Road Traffic Accident Statistics

Click to enlarge the image

Quoting the numbers from the NHTSA estimate for 2009 motor vehicle traffic fatalities, Ray LaHood – the Secretary of the US Department of Transportation, noted on his blog that he is extremely encouraged by the significant drop in fatalities on American roads but at the same time he is disturbed by the fact that “we are still talking about nearly 34,000 preventable deaths a year. There are still too many people dying in traffic accidents every year. Just too many.”

On 2 March 2010 governments around the world took the historic decision to increase action to address the road safety crisis over the next ten years. The UN General Assembly resolution proclaiming a Decade of Action for Road Safety 2011-2020 (A/64/L.44/Rev.1) was tabled by the Government of the Russian Federation and cosponsored by more than 90 countries. WHO welcomes this proclamation which seeks to save lives by halting the increasing trends in road traffic deaths and injuries world-wide.  A draft Plan for the Decade, which was prepared by WHO with support from members of the UN Road Safety Collaboration, is now open to all stakeholders for comments. Visit the Collaboration’s web site at http://www.who.int/roadsafety.

Some nuggets of information for you that will make you gasp (courtesy of World Health Organization’s report on road safety titled The Decade of Action for Road Safety 2011-2020):

  • Over 3000 people die on the world’s roads every day.
  • Tens of millions of people are injured or disabled every year.  Nearly 1.3 million people are killed each year. If trends continue unabated deaths will rise to an estimated 2.4 million a year by 2030.
  • Between 20 and 30 million sustain non-fatal injuries.
  • It’s predicted that by 2030, the amount of people who are killed in road traffic accidents will rise to fifth in the leading causes of death around the world. Currently it is in ninth place.

Hopefully, with improved funding and targeted attention towards issues like distracted driving and drunk driving, we can expect a decrease in this trend.   Oh if are wondering how you personally contribute towardsaddressing the problem — Leave your keys behind and take transit systems (buses, trains, etc) if you can.   If you have the proper infrastructure, you can consider walking or biking to places instead of driving. Next time when you drive your car/ motorcycle/bicycle ,  remember that you are not just driving for your own safety but also also for those of others who share that road with you.  At the end of the day, there is only so much the goverments can do to keep is safe and we the citizens have to realize that they have a very important and personal role to play in keeping our roads safe.  Let’s do it!

Reblog this post [with Zemanta]

Graphical depiction of the Sen. Jim Bunning Catastrophe for Transportation

March 1, 2010 at 7:54 pm
The Bunning effect

Image courtesy: via McClatchy

Here is a bullet point version of the evolving mess created in the U.S. Senate, courtesy of Kentucky’s nomination for Hall of Political Shame: Sen. Jim Bunning.

Let’s start with a mini profile of the Senator himself:

  • A former Major League pitcher – Bunning pitched in the Major Leagues for 17 seasons, most notably with the Detroit Tigers and the Philadelphia Phillies. When he retired, he had the second-highest total of career strikeouts in Major League history;
  • In 2004, he barely won election in Kentucky in a campaign highlighted by blunders such as describing opponent Daniel Mongiardo as looking “like one of Saddam Hussein’s sons” and being “limp-wristed.”
  • In 2006, TIME called him one of America’s five worst senators, calling out the former MLB pitcher for showing “little interest in policy unless it involves baseball.”

Now a mini profile of the problem, courtesy of The Economist:

  • Last July Jim Bunning, realized he was too wildly unpopular in the state of Kentucky to win re-election to the Senate, so he decided to retire.
  • On his way out, he figured he’d make sure people had something to remember him by. Last Friday, Mr Bunning extended a one-man procedural gambit that has blocked approval of an emergency extension of unemployment benefits, making it nearly certain that Americans who are out of work will stop receiving their payments on Sunday.
  • Mr Bunning insists that funding measures (presumably, given his political leanings, spending cuts) be found to pay for the unemployment benefits. He is not being supported by the Republican leadership.

Now let’s proceed to read what the newspapers around the country have to say about Mr. Bunning’s theatrics and the ripple effects of his actions:

McClatchy:  The Department of Transportation furloughed nearly 2,000 employees without pay Monday as the government began to feel the impact of Republican Sen. Jim Bunning’s one-man blockage of legislation that would keep a host of federal programs operating. Bunning’s “hold” also affects jobless benefits for thousands of unemployed workers, rural television customers, doctors receiving Medicare payments and others. Bunning wants the $10 billion price of extending the programs offset by reductions in spending elsewhere in the budget to not drive up the deficit.

From Washington Post:  “I am keenly disappointed that political games are putting a stop to important construction projects around the country,” Transportation Secretary Ray LaHood said in a statement late Sunday night. “This means that construction workers will be sent home from job sites because federal inspectors must be furloughed.”

Another Washington Post article:  He doesn’t seem too happy about the extra attention. When ABC News tried to get him to comment on the block, he ignored them, yelling, “Excuse me! This is a senators-only elevator!” and “I’ve got to go to the floor!” According to the network producer Z. Byron Wolf, before the camera crew started filming Bunning gave them the middle finger.

A NY Times blog says: “As the fight drew to a close, Mr. Bunning complained he had been ambushed by the Democrats and was forced to miss the Kentucky-South Carolina basketball game. He said Democrats caused their own problems by dropping the program extensions from an earlier bipartisan jobs measure.”

British Newspaper The Telegraph Says:  Is this America’s worst politician?….  It takes quite some doing to be rude, angry, non-communicative and elitist all in a mere 26 seconds. But Senator Jim Bunning of Kentucky, who is not seeking re-election and has been all but abandoned by his Republican colleagues, manages it in this vintage clip from ABC News.

The Wall Street Journal Says: Many Republican leaders, cognizant of the political peril surrounding Mr. Bunning’s action, quietly distanced themselves. But others, including Arizona’s Jon Kyl, the Senate’s second-ranking Republican, supported Mr. Bunning’s right to raise the cost issue. “Every time we pass one of these bills, we are adding to the deficit, and we are not creating jobs,” Mr. Kyl said. “And it’s a legitimate point for Republicans to make.”

Click here to read all the related stories about this obscure Senator from Kentucky here.

Reblog this post [with Zemanta]

Event Alert: Reclaiming our Competitive Advantage: How Intelligent Technologies are Revolutionizing Transportation and What America Can Do to Lead the World in 21st Century Innovation

March 1, 2010 at 1:50 pm

Date: Wednesday, March 3, 2010

Time: 4:00 – 5:30 PM

Venue : 2167 Rayburn House Office Building, Washington, D.C.

Event Host: The Intelligent Transportation Society of America (ITS America)

cid:image002.gif@01CAAB29.553B7810

From highways and transit systems to passenger vehicles and freight transportation, intelligent transportation systems (ITS) are beginning to transform our nation’s transportation network and provide significant benefits to our communities, businesses and other transportation users.  ITS technologies are already being used in many parts of the U.S. to reduce traffic crashes, congestion, operating costs, and carbon emissions while helping to improve transportation efficiency and spur job growth.  But as a recent report by the Information Technology and Innovation Foundation highlights, the U.S. is falling behind leading Asian and European nations in deploying ITS technologies (see recent Wired News coverage here and here).

As Congress and the Administration work to spur economic growth and address critical transportation and environmental challenges, this is an opportunity to engage with leading transportation, transit, automotive, and economic policy experts in a discussion about how information and communications technologies are modernizing our nation’s infrastructure, and what steps can be taken to advance the deployment of current and next generation ITS technologies to create a smarter, safer, cleaner, and more efficient transportation system.  Please join ITS Caucus co-chair Russ Carnahan (D-MO) and our distinguished panelists for a discussion about the future of ITS in America, including how smart technologies can benefit your community and how policymakers can help the U.S. reclaim its role as an innovation leader.  Please RSVP to Charlie Tennyson at ITS America at ctennyson@itsa.org or 202-721-4207.

Moderator: Scott F. Belcher (bio)
President and CEO, The Intelligent Transportation Society of America (
ITS America)
Guest Speaker: U.S. Congressman Russ Carnahan (D-MO) (bio)

Co-Chair, Congressional ITS Caucus

Panelists: Ann Flemer (bio)
Deputy Executive Director, Policy, San Francisco Bay Area Metropolitan Transportation Commission (
MTC)

John Inglish (bio)
General Manager and CEO, Utah Transit Authority (
UTA)

Kirk Steudle (bio)
Director, Michigan Department of Transportation (
MDOT)

Keith Cole (bio)
Director, Legislative and Regulatory Affairs, General Motors (
GM)

Robert Atkinson (bio)
President, The Information Technology and Innovation Foundation (
ITIF)

Date: Wednesday, March 3, 2010
Time: 4:00 PM – 5:30 PM
Place: 2167 Rayburn House Office Building

Washington, DC 20515 (map)

Note:  ITS America is a 501(c)(3) nonprofit association that represents several hundred member organizations including public sector agencies, private industry leaders, and academic institutions working to advance the research, development, and deployment of technologies that improve transportation safety, mobility, economic competitiveness, and the environment.  Register here to attend ITS America’s 2010 Annual Meeting and Exposition, which will be held in Houston, Texas from May 3 – 5.  Featured speakers include U.S. Secretary of Transportation Ray LaHood, IBM Chairman, President and CEO Sam Palmisano, and other public sector, private industry, and academic leaders from across the country.

Reblog this post [with Zemanta]

2010 ITS America Annual Meeting Student Essay Competition

February 22, 2010 at 7:13 pm

ITS America’s 20th Annual Meeting & Exposition, scheduled forMay 3-5, 2010, at the George R. Brown Convention Center in Houston, Texas will provide transportation professionals and policymakers the necessary tools and strategies they need to create communities that are safer, cleaner, more livable and less congested.

This year’s theme is “Connecting Communities through Smart Transportation Solutions.” We will also provide you with important policy insight from government officials and planning insights from leading transportation practitioners.

The competition, held in conjunction with the 2010 ITS America Annual Meeting & Exposition and sponsored by Southwest Research Institute, provides an opportunity for today’s transportation and engineering students to apply their knowledge in a thought-provoking and enjoyable competition and to build awareness of a career path with unlimited potential in the ITS industry.  Contest guidelines are attached.

2010 Student Essay Competition Guidelines

The Student Essay Competition is designed to encourage student interest and future participation in the development of intelligent transportation systems (ITS) and solutions. The objective of the essay competition is to provide an opportunity for today’s transportation and engineering students to apply their knowledge in a thought-provoking and enjoyable competition and to build awareness of ITS as a career path with unlimited potential.  Essays will be judged on their creativity, quality of exposition, originality, depth of knowledge, and awareness of ITS issues and challenges.

Eligibility Requirements

  • Authors must be graduate or undergraduate full-time students enrolled in an accredited institution of learning in the U.S.
  • Entries are limited to one paper per student and should be original, unpublished work of an individual student.

Essay Topics

Essays must be based on one of the following topics.  You may also focus the paper on the sub-topics listed:

Topic 1:  Cooperative Systems

  • How cooperative systems will quantitatively improve the performance of standalone active vehicle safety systems?
  • One of the challenges of implementing cooperative systems is the penetration rate required.  What are the barriers to achieving the necessary penetration rates in order to realize system level benefits of a specific cooperative system/application?
  • Describe relevant research into the application of multi-agent/intelligent agent theory on current transportation challenges.

Topic 2: How will Traffic Management evolve, possible subtopics:

  • What new technologies/approaches will be used for collecting traffic status data?
  • How will regions integrate their data to provide consolidated views for the traveling public?
  • How can the information dissemination to travelers be improved?

Essay Format Requirements

  • The cover page must include the title of the essay, author’s name, name of school, mailing address, phone number, and the student’s e-mail address and phone number.  The author’s name and essay title should appear at the top of all other pages.
  • Essays should be typed, double spaced, and appear on 8 ½”x11” white paper.
  • A complete bibliography should be included, if appropriate.
  • Essays are not to exceed 2,000 words in length, must be written by only one person, and should not have appeared in any publications other than in school publications.
  • Essays will be evaluated considering: writing quality and clarity; interest of the topic and content to the broad Intelligent Transportation Systems industry; analysis and reasoning; timeliness, originality, and creativity; quality and use of research; and compliance with these rules.

AWARDS

The 1st, 2nd , and 3rd place winners will :

  • receive $1,500, $1,000, or $500 respectively to cover expenses of their trip to the conference.
  • receive a complimentary full registration to attend the conference.
  • have the opportunity to present their winning essay at the dedicated Interactive Session area in the exhibit hall on Tuesday, May 4, 2010,
  • have their winning essay displayed on the Student Essay Competition Web page of ITS America’s
  • be featured in nationally-distributed press releases.

Application Procedure

Entries must be submitted in electronic formats.  Essays must be accompanied by a cover letter from a faculty advisor or department chair.  E-mail essays to Edgar Martinez at emartinez@itsa.org by 5 p.m. (EST) on March 15, 2010.

Selection

Entries will be reviewed and the final selections made by a selection committee comprised of ITS America members and Southwest Research Institute representatives.  The winners will be notified on March 29, 2010.

ITS America and Southwest Research Institute strongly encourage the winners to be present for the awards ceremony on Monday, May 3, 2010, at the George R. Brown Convention Center in Houston, Texas.

Questions should be directed to Edgar Martinez at 800-374-8472 ext. 4223 or emartinez@itsa.org.   For more information, please visit the 2010 ITS America Annual Meeting website.

Reblog this post [with Zemanta]

Young Professionals in Transportation (YPT) Leadership Seminar on Transportation Policy – Feb 24, 2010 @ 6PM

February 17, 2010 at 7:23 pm

When:  Wednesday 24 February 2010; 6:00-7:30 PM

Where:  Capitol Visitor Center Room SVC-20 , E Capitol St NE & 1st St NE, Washington, DC

Young Professionals in Transportation (YPT) is pleased to announce the February 2010 Leadership Seminar on Transportation Policy featuring leading industry figures in shaping the nation’s surface transportation vision.  This panel discussion will feature representatives from three major recent efforts that examine the current state of the transportation system and offer policy recommendations moving forward based on a series of testimonies and rigorous research.

In addition, panelists will offer their thoughts on professional development and leadership skills necessary to make a difference in the arena of national decision-making.

Featured Panelists:

Jack Schenendorf, Of Counsel, Covington and Burling – Representing the National Surface Transportation Policy and Revenue Study Commission

Jack Schenendorf’s practice concentrates on transportation and legislation with a particular focus on legislative strategy, legislative procedure, and the federal budget process. He was recently appointed by Speaker Hastert to the National Surface Transportation Policy and Revenue Study Commission, where he serves as Vice-Chairman. For nearly 25 years, Mr. Schenendorf served on the staff of the Committee on Transportation and Infrastructure of the U.S. House of Representatives. He was Chief of Staff from 1995 to 2001. In BNA’s Daily Report for Executives, Mr. Schenendorf was described “as one of the most powerful staffers on the Hill, [who] has played a large role in crafting every piece of major transportation legislation in the past decade.” Prior to joining the firm in 2001, Mr. Schenendorf served on the Bush/Cheney Transition where he was Chief of the Transition Policy Team for the U.S. Department of Transportation and was responsible for reviewing all transportation policies and issues for the incoming Administration.

Kathy Ruffalo, President, Ruffalo and Associates LLC – Representing the National Surface Transportation Infrastructure Financing Commission

President of Ruffalo and Associates, LLC – a government affairs consulting firm in Washington, D.C. Ms. Ruffalo has 20 years of experience in the public policy arena at both federal and state levels of government. From 1989 to 1999, she served as a senior advisor to the United States Environment and Public Works Committee – for then Chairman Senator Max Baucus – with the primary responsibility for developing, drafting and negotiating federal transportation policy. From 1999 to 2004, she was a senior policy advisor to Idaho Governor Dirk Kempthorne. In 2004, she was recruited to return to Capitol Hill where she was a key drafter and negotiator of SAFETEA-LU. She is a 1989 graduate of Northwestern University with a Bachelor of Science degree in Industrial Engineering and Management Sciences.

Emil Frankel, Director of Transportation Policy – Representing the Bipartisan Policy Center’s National Transportation Policy Project

Emil H. Frankel is an independent consultant on transportation policy and public management issues. He serves as Director of Transportation Policy for the Bipartisan Policy Center. Mr. Frankel was Assistant Secretary for Transportation Policy of the United States Department of Transportation from 2002 to 2005. Appointed by President George W. Bush, Mr. Frankel played a key role in the coordination and development of the Administration’s proposal to reauthorize the Federal highway, transit, and highway safety programs. From 1991 to 1995, he was Commissioner of the Connecticut Department of Transportation. Between state and Federal service, Mr. Frankel was Of Counsel to Day, Berry & Howard in the law firm’s Stamford, Connecticut, office. During that time he was also a Management Fellow of Yale University’s School of Management and a Senior Fellow at the Yale School of Forestry and Environmental Studies, engaged in teaching and research on issues of transportation, energy and environmental policy and public management. Also at the Yale School of Management and Yale School of Forestry and Environmental Studies, Mr. Frankel will be a visiting lecturer in Spring 2008. From 1999 to 2001 he was a Selectman of the Town or Weston, Connecticut. Mr. Frankel received his Bachelor’s Degree from Wesleyan University and his LL.B. from Harvard Law School, and was a Fulbright Scholar at Manchester University in the United Kingdom. From 1981 to 1997 he was a member of the Board of Trustees of Wesleyan University, where he is now a Trustee Emeritus.

RSVP: Due to security restrictions, a list of names for non-Congressional staff must be submitted to the Capitol Visitor Center prior to the event.  Please send your RSVP to ypt@transportation.org with “YPT Seminar” as the subject by COB Monday 22 February 2010.

Analyzing AASHTO’s “Projects and Paychecks: a One-Year Report on State Transportation Successes under the American Recovery and Reinvestment Act”

February 10, 2010 at 8:09 pm

Streetsblog-Capitol Hill’s Elena Schor posted an interesting analysis a report titled Projects and Paychecks: a One Year Report on State Transportation Successes under the American Recovery and Reinvestment Act (and a website), released yesterday by the American Association of State Highway and Transportation Officials (AASHTO), the trade group representing state DOTs in Washington.. The report is billed as a one-year “progress report” on the White House’s $34.3 billion in formula-based American Reinvestment and Recovery Act (ARRA) a.k.a stimulus spending on transportation projects.

The comprehensive study finds that one year after its passage, state DOTs have set an amazing record of speed and efficienc:

  • 77 percent of the $34.3 billion provided for highways and transit out to bid on 12,250 transportation projects.
  • The 9,240 projects under construction total $20.6 billion.
  • One hundred-fifty of these projects are profiled on the companion website at: recovery.transportation.org.
  • As a result of the Recovery Act, 280,000 direct, on-project jobs have been created or sustained across the country.

An excerpt from Elena’s analysis:

Interestingly, the group’s chart [PDF shown below] showing state-by-state progress on transportation stimulus omits the estimates of jobs created by each category of spending — perhaps because a December analysis of those totals showed that transit was a more cost-effective employment generator than road projects.

Overall, the report attempts to make a case for more investment in infrastructure as part of a second round of job-creation legislation, using anecdotes from state DOT officials and local construction workers who claimed a steady paycheck thanks to the stimulus law.

The press release to mark the occasion has the following nugget, which I thought is very interesting:  “With bids running as low as 30 percent below estimates, the study finds that states stretched federal dollars even further, creating more jobs and more miles of improvements. California, Georgia, and Texas awarded more than 90 percent of their highway contracts below original cost estimates.

The report, which includes data from the states, House Transportation and Infrastructure Committee, and the Federal Highway Administration, also found an impressive list of completed projects. As of January 7, 2010, 1,125 bridges had been improved or replaced, 21,400 miles of pavement had been resurfaced or widened, and 1,700 safety traffic management projects had been put into place.”

Making the case for more Transportation investment: “Projects and Paychecks proves just how big a role stimulus is playing to keep Americans working,” said John Horsley, AASHTO executive director. “In January, state DOTs identified more than 9,800 additional ‘ready-to-go’ projects worth $79 billion. Congress needs to move quickly to pass another Jobs Bill. This study proves transportation projects can deliver hundreds of thousands of jobs for America,” Horsley said.

Click here to access the website or here to download the report.

Reblog this post [with Zemanta]

Webinar Alert: Social Media – What is it? How can my agency use it? What experience have others had?

January 19, 2010 at 6:33 pm

Social Media – What is it? How can my agency use it? What experience have others had?

The I-95 Corridor Coalition is hosting a webcast titled “The Use of Social Media for Travel Information” on Thursday, January 28, 2010 from 10:00 AM to 11:30 AM (EST).

Many areas of interest regarding Social Media will be discussed during this webcast including: how it works, what information can be shared using it, how to implement it, how to get management buy-in for it, how do you know if it is working, and where is it all headed. In addition, two case studies from New York State DOT and North Carolina DOT will be highlighted.

For more information and to sign up for this no-cost webcast, please see the notice on the I-95 Corridor Coalition website athttp://www.i95coalition.org/

China strengthens transportation infrastructure muscle, again; Starts construction of world’s longest sea bridge (37.6 kms)

December 16, 2009 at 7:52 pm

(Sources:  The Guardian, UK, New Civil Engineer)

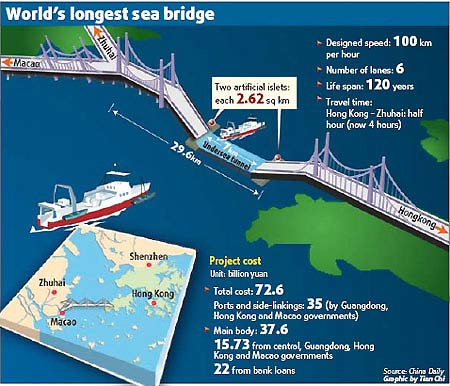
China today announced it had begun construction of the world’s longest sea bridge – barely 18 months after opening the current record-holder.

The Y-shaped link between Hong Kong, Macau and China will be around 50km (31 miles) long in total, 35km of which will span the sea, said the state news agency Xinhua. Due to be completed by 2015, the 73bn yuan (£6.75bn) cost of the bridge will be shared by the authorities in the three territories.

Here are some interesting design features of this project as noted on the Hong Kong Government’s Highways Department website:  The HZMB Main Bridge is a 29.6km dual 3-lane carriageway in the form of bridge-cum-tunnel structure comprising an immersed tunnel of about 6.7 km. According to the current option, It runs from the artificial island off Gongbei of Zhuhai to the eastern artificial island for the tunnel section just west of the HKSAR boundary.

The Highways department website notes that this project includes construction of a 29.6 km dual three-lane carriageway in the form of bridge-cum-tunnel structure comprising a tunnel of about 6.7 km and the construction of two artificial islands for the tunnel landings west of the HKSAR boundary

The structure also includes a 5.5km underwater tunnel with artificial islands to join it to bridges on each side. According to the engineering group Arup – which has helped with the design – it is the first major marine bridge-and-tunnel project in China. But the engineering firm described the structure as 38km in length; the reason for the disparity in the bridge length was unclear.

Work is expected to begin with land reclamation to create an artificial island of around 216 hectares (540 acres) off Zhuhai. This will become the customs point for those making the crossing.

But much of the structure will be prefabricated offsite, so, for example, the concrete deck sections can be produced at the same time as the foundations are laid. The tunnel will be made of precast sections – each 100 metres long.

“It is designed with a service life of 120 years. It can withstand the impact of a strong wind with a speed of 51 meters a second, or equal to a maximum Beaufort scale 16 (184 to 201kmph),” said Zhu Yongling, an official in charge of the project construction. “It can also resist the impact of a magnitude-8 earthquake and a 300,000-tonne vessel.”

According to an article in New Civil Engineer magazine earlier this year, the bridges cross three navigation channels while the tunnel goes under a fourth.

“There is an airport nearby, so we could not build a bridge [in that area] which was the reason for the tunnel. The immersed tube is the longest in the world at 5.5km long,” Naeem Hussain, global bridge leader at Arup, told the publication.

He said the bridge’s piers would each be 170 metres high and that the design team had minimised the structures impact on estuary flows by limiting the size and number of columns in the water.

The project has been on the drawing board for some time after first being discussed by politicians in the 1980s. The Hong Kong-Zhuhai-Macau Bridge (HZMB) Advance Work Coordination Group was established in 2003 and the China’s Central Government and the regional governments of Guangdong, Hong Kong and Macau agreed finance last summer. “The idea of having a bridge came more than 20 years ago around 1983 and came from a local tycoon named Sir Gordon Wu,” says Arup director Daman Lee.

Creating the two islands where the tunnel dives under the sea involves a considerable land reclamation work. “The border crossing facility in Hong Kong will have to be created from scratch as a reclaimed island,” said Lee. “It’s 120ha so it’s quite a big place. A car would come in from Zhuhai, go through customs and then onto Hong Kong. Or it would park there and public transport would be used. Macau is too small to allow for car traffic so all cars [from Hong Kong and China will have to] park [at the border crossing] and take public transport”.

The Hong Kong Government’s Highways Department website offers some interesting estimates about the traffic volume projections for this new sea link and offers this strategic outlook from an economic standpoint: The HZMB will be strategically important to the further economic development of Hong Kong, Macao and the Western Pearl River Delta region. It will significantly reduce transportation costs and time for travelers and goods on the road, but the benefits go far beyond this. With the HZMB, the Western PRD will fall within a reachable three-hour commuting radius of Hong Kong. This would enhance the attractiveness of the Western PRD to external investment, which is conducive to the upgrading of its industry structure. Hong Kong will benefit from this new economic hinterland, with its vast human and land resources which will provide ample opportunities for Hong Kong businessmen to expand their operation in the Mainland.

The Economic Net Present Value (ENPV) of the project is about RMB¥40 billion for an operation period of 20 years. The estimated ENPV for Hong Kong is about RMB¥23 billion as compared to RMB¥13 billion for the Mainland and RMB¥4 billion for Macao. The Economic Internal Rate of Return of the project is 8.8% in respect of Hong Kong over a 20-year period, or 12% over a 40-year period.

Click here to read the entire Guardian article. Also, do not hesitate to visit the Wiki page for this project, which offers far more information than any other source on the web, covering a whole slew of project information, assembled from various sources.

FHWA’s Transportation and Climate Change Newsletter – October 2009

December 8, 2009 at 12:03 am

(Source: Office of Planning, Environment and Realty – Federal Highway Administration)

Recent Events

U.S. DOE and U.S. EPA announce the 2010 Fuel Economy Guide for model year 2010 vehicles. Each vehicle listing gives an estimated annual fuel cost, based on the vehicle’s MPG rating and national estimates for annual mileage and fuel prices. The online version of the guide allows consumers to input their local gasoline prices and typical driving habits to receive a personalized fuel cost estimate. Fuel efficiency is important for reducing CO2 and other GHGs. The top ten fuel economy leaders for 2010 include nine hybrid vehicles, from compact cars to SUVs.

World Resources Institute issues provisional GHG emissions reporting standard for public sector. The standard was developed in consultation with agencies from all levels of government and is supported by the Federal Energy Management Program within U.S. DOE and U.S. EPA. The standard includes guidance on how to apply GHG accounting principles to government operations at the federal, state and local level. The standard is compatible with the Local Government Operations Protocol recently adopted by The Climate Registry, ICLEI Local Governments for Sustainability (ICLEI), the California Air Resources Board (CARB) and California Climate Action Registry (CCAR). For questions or to submit comments on the standard, please email Stephen Russell or Mary Sotos at pspcomments@wri.org.

EESI publishes State Actions on Climate Change: A Focus on How Our Communities Grow, to encourage State, regional, and local governments to focus on land use reform as a key strategy for reducing GHG emissions. The publication is the result of collaboration with the American Planning Association to develop tools to assist planners. The study examined State and regional climate action plans for their inclusion of transportation, green building, and land use or “smart growth” practices and found that the plans cover a broad range of strategies, because each area has unique geographic and socioeconomic conditions. Of the three, transportation practices were the dominant feature, along with, to a lesser degree, green building policies. Some common transportation policies include adopting California’s vehicle emissions standard (the country’s most aggressive standard), creating more mass transit options, and providing incentives to lower VMT. Specific smart growth practices appeared to be the least likely component of the plans. A table at the end of the document shows some aspects of urban planning that are incorporated. Any GHG reduction targets adopted or regional climate action plans to which a state belongs are provided.

Simple Measures Can Yield Big GHG Cuts, Scientists Say in Proceedings of the National Academy of Sciences. Dr. Thomas Dietz, Michigan State University assistant vice president for environmental research, and his colleagues find that simple, voluntary activities such as routine vehicle maintenance, carpooling and trip chaining, eco-driving, and use of low-rolling-resistance tires can result in significant reductions in GHG emissions and, therefore, “deserve increased policy attention.” They examined 17 household action types in five behavioral categories. Adoption of these actions typically is the result of several policy tools and strong social marketing, the authors state. They estimate that if the behaviors became the norm across the nation it could save 123 million metric tons of carbon per year, equal to 7.4% of U.S. national emissions, within ten years with little or no reduction in household well-being. Their estimates are based on “how many families could reasonably be expected to take such measures if they were provided information, offered financial assistance and could interact with others doing so.”

Managing Our Coastal Zone in a Changing Climate: The Time to Act is Now Issued by the Parliament of the Commonwealth of Australia Provides Insights Relevant to U.S. The fact that many Australian coastal communities have single-access roads is an issue of grave concern to the Commonwealth. The report noted that evacuation routes were a significant factor in the extent of a July 2009 bushfire tragedy (“Black Saturday”). Dr. John Church, from [the Commonwealth Scientific and Industrial Research Organisation, Australia’s national science agency] pointed out that “sea-level-rise planning benchmarks need to be part of a risk management framework,” stating “We really have to move into a risk assessment framework…where we talk more about probabilities and the risks that we are prepared to take….One problem that we have is that planners tend to come to us and say, “How much do we need to allow for sea level rise?’ The retort I always give is, ‘What kind of risks do you want to take?’ I think this is a very important change in process that we need: to put the onus of the risk back onto the planners and the policymakers, not leave it to the scientists.’

State and Local News

Draft Pennsylvania Climate Action Plan released for comment. The plan contains 52 climate policy actions, which are estimated to reduce the Commonwealth’s GHG emissions by 95.6 million metric tons (a 36 percent reduction below year 2000 business-as-usual levels, 42% if recent state and federal actions are included) and to provide a net gain of $5.13 billion and 54,000 new jobs by 2020. The Plan does not address climate change adaptation. The GHG emissions inventory and projections, which cover 1990 to 2020, use “standardized methodology prescribed by the [EPA] and in accordance with international standards.” Transportation is the third largest source of GHG emissions in Pennsylvania (24% in 2000, of which gasoline-powered on-road vehicles accounted for about 64% and on-road diesel vehicles for 15%). Of all the sectors analyzed, GHG mitigation actions from transit and ground passenger transportation are projected to produce the second largest financial gain for the Commonwealth. The Land Use and Transportation work plan recommendations are listed in the following table.

Land Use and Transportation (LUT) Work Plan Recommendations
Work Plan No. Work Plan Name Annual Results (2020) Cumulative Results (2009-2020) CCAC Voting Results (yes/No / Abstained)1
GHG Reductions (MMtCO2e Costs (Million $) Cost Effectiveness ($/tCO2e) GHG Reductions (MMtCO2e Costs (NPV, Million $) Cost Effectiveness ($/tCO2e)
3 Low-Rolling-Resistance Tires .68 -$212 -$310 4.1 -$1,244 -$300 16/5/0
5 Eco-Driving PAYD .43 -$277 -$651 1.76 -$1,065 -$605 13/8/0
Feebates .41 -$133 -$320 2.74 -$810 -$296 13/8/0
Driver Training .62 -$129 -$206 4.53 -$605 -$134 13/8/0
Tire Inflation .09 -$27 -$282 0.58 -$137 -$238 13/8/0
Speed Reduction 1.96 $185 $94 23.0 $4,153 $181 13/8/0
6 Utilizing Existing Public Transportation Systems .05 $300 $6.000 0.55 $3,000 $5,454 13/8/0
7 Increasing Participation in Efficient Passneger Transit .12 <$0 <$0 2.02 <$0 <$0 21/0/0
8 Cutting Emissions From Freight Transportation .99 -$293 -$295 6.67 -$1,495 -$224 15/6/0
9 Increasing Federal Support for Efficient Transit and Freight Trasport in PA 1.17 $92 $78 12.87 $1.0082 $78 20/1/0
10 Enhanced Support for Existing Smart Growth/Trasportation and Land-Use Policies .76-1.84 <$0 <$0 3.79-9.18 <$0 <$0 13/8/0
11 Trasit-Oriented Design, Smart Growth Communities, & Land-Use Solutions Included in T-10 <$0 <$0 Included in T-10 <$0 <$0 13/8/0
Sector Total After Adjusting for Overlaps 6.6 -$494 -$75 60.1 $2,805 $47
Reductions From Recent State and Federal Actions 15.7 -$1093 -$313 72.0 -$3803 -$253
1 Pennsylvania Clean Vehicles (PCV) Progarm 0.095 0.0 0.0 1.27 0.0 0.0 NA
Federal Vehicle GHG Emissions and CAFE Standards 12.2 NQ NQ 57.3 NQ NQ NA
2 Bofuel Developemnt and In-State Production Incentive Act 3.47 -$89 -$26 14.8 -$203 -$14 NA
4 Diesel Anti-Idling Program 0.07 -$20 -$273 0.7 -$177 -$238 NA
Sector Total Plus Recent Actions 22.3 -$603 -$27 132 $2,425 $18

1NA in this column means “not applicable.” Work plan numbers 1,2, and 4 are recent state actions that are being implemented by the state; and the federal government will be implementing national vehicle GHG emissions and corporate average fuel economy (CAFE) standards starting in 2012.
2Because T-9 uses federal dollars exclusively, it should be noted that the cost figures for T-9 are calculations of how many federal dollars – not state dollars – would be required to implement the work plan.
3This cost per ton value excludes the emission reductions associated with the “Federal Vehicle GHG Emissions and CAFE Standards” since costs (savings) were not quantified for this recent federal action.
GHG = greenhouse gas; MMtCO2e = million metrice tons of carbon dioxide equivalent; $/tCO2e = dollars per metric ton of carbon dioxide equivalent; NPV = net present value; NQ = not quantified; PA = Pennsylvania; PAYD = Pay-As-You-Drive; CAFE = Corporate Average Fuel Economy.

Climate Change and Transportation in Maine published by MaineDOT. This white paper prepares MaineDOT to respond to the Governor’s call to evaluate climate change adaptation options and positions the agency to work with transportation stakeholders to evaluate short-term and long-term approaches to preparing for and adapting to climate change. Judy Gates, Director of MaineDOT’s Environmental Office said “…uncertainty [about long-range impacts due to climate change] can create paralysis in an agency charged with making and justifying long-term, fiscally-responsible decisions around the safety and efficiency of public travel. But the long life-cycles of most transportation infrastructure demand early preparation to protect significant tax payer investments…” The white paper includes a table showing how Maine’s current and proposed adaptation strategies compare to seven other States whose Climate Action Plans address adaptation (see below). The paper references the part of TRB’s Special Report 290: Potential Impacts of Climate Change on U.S. Transportation that discusses the Caltrans process of evaluating bridges for seismic retrofitting, in which TRB suggests that a similar approach could be used to screen and identify critical infrastructure that is vulnerable to the impacts of climate change. MaineDOT has already included climate change as a factor to be considered in future planning with an eye towards conducting technical, risk-based assessments such as California’s.

Adaptation Strategies States have Recommended
RECOMMENDED STRATEGY AK CA FL MD OR VT WA ME
Monitor the changing environment X X X X X X X X
Assess infrastructure’s resiliency to climate change impacts X X X X X X
Cost/benefit or risk based analysis of retrofitting/replacing vulnerable infrastructure X X X
Incorporate climate change into current and future planning X X X X X X X X
Reduce stress on threatened and endangered species X X X
Design/build infrastructure to withstand climate change impacts X X X X X X
Maintain/restore habitat connectivity and/or natural barriers to sea level rise X X X X

Announcements

Behavior, Energy and Climate Change Conference in DC, November 16-18, has webcast option. The webcast costs $150 for one day or $300 for all three days, versus $320 and $600, respectively, for on-site attendance. The webcast option is limited to 200 people who register by November 12.The conference is sponsored by the American Council for an Energy-Efficient Economy, Stanford University’s Precourt Energy Efficiency Center, and the California Institute for Energy and Environment.

TRB announces webinar: A Transportation Research Program for Mitigating and Adapting to Climate Change and Conserving Energy. This web briefing on December 2, from 2:00-3:00 p.m. EST will explore the findings of TRB’s Special Report 299: A Transportation Research Program for Mitigating and Adapting to Climate Change and Conserving Energy.Participants must register at least 24 hours in advance, space is limited, and there is a fee for non-TRB-Sponsor employees. To learn more about current and planned FHWA research on climate change mitigation and adaptation, visithttp://www.fhwa.dot.gov/hep/climate/index.htm.

FYI

What is the United Nations Framework Convention on Climate Change (UNFCCC), the Convention? The Convention is an international treaty adopted in 1992 in Rio de Janeiro and ratified by almost all of the countries of the world, in which they agreed to undertake policies and measures to return their greenhouse gas emissions to 1990 levels by 2000. In 1997, all but two of the Convention signatories (the U.S. and Turkey) adopted an addition to the Convention, the Kyoto Protocol, which has specific binding GHG emission targets to be achieved in the 2008 – 2012 time period (which would have been 7% for the U.S.) The U.S. has not ratified the Protocol primarily because China and India are exempt from a numerical cap on their emissions. Below are data from the UNFCCC on trends in GHG emissions in industrialized countries (called Annex I Parties) that committed to voluntary GHG reductions under the Convention

Table showing 1990-2006 trends for Annex I Parties to the United Nations Framework Convention. Click on the image to display tabular data

Bar Chart showing GHG emission trends in major signatories to the Convention 1990-2007 (including Land Use, Land-Use Change, and Forestry) Click on the image to display tabular data

Related news. Indian Environment and Forest Minister Jairam Ramesh and Chinese Minister for National Development and Reforms Xie Zhenhua signed a 5-year commitment for their countries to collaborate on GHG emission reduction programs, projects, technology development, and demonstration. The Ministers agreed to work together to protect and promote the interests of developing countries like China and India.

Next month:What is “cap and trade” GHG emissions trading, which is in the media so much lately?

USDOT Awards Funds to Dallas, San Diego for New Technology Initiative to Fight Congestion

December 7, 2009 at 3:50 pm

(Source: USDOT Press Release)

Dallas and San Diego selected as Integrated Corridor Management Pioneer Demonstration Sites

In an historic step towards ending gridlock in urban areas across the country, the U.S. Department of Transportation today announced that the Dallas and San Diego areas will receive $14 million as the nation’s first demonstration sites for new Intelligent Transportation System (ITS) technologies that help fight congestion and enhance travel.  The Integrated Corridor Management (ICM) initiative will help the Dallas and San Diego metro areas become “living laboratories” in the fight against congestion.

“These communities are leading the way by using state-of-the-art technologies to create a commute that is safer, less congested and more convenient.” said U.S. Transportation Secretary Ray LaHood.  “America can’t simply build our way to a more modern and efficient transportation infrastructure.  These projects will show the rest of the nation that bumper-to-bumper traffic doesn’t have to be the status quo.”

Dallas Area Rapid Transit (DART) will contribute $3 million for an $8.3 million project. DART will use a transportation management model to predict travel conditions 30 minutes into the future, allowing diversion of traffic to other routes during freeway incidents and special events along US-75.  Travelers will have access to real-time information about traffic, public transit and expected travel times, through wireless and web-based alerts.

The San Diego Association of Governments and its partnering agencies will contribute $2.2 million for a $10.9 million project.  San Diego will use ITS investments along I-15 to enable a “smart” traffic management system that combines road sensors, video and traveler information to take steps to reduce congestion.  It will deliver information to commuters via the internet and message signs and will enable managers to adjust traffic signals and ramp meters to direct travelers to HOV lanes, HOT lanes, bus rapid transit and other options.

Since 2005, ICM has laid the groundwork for transportation agencies to use existing roads, intersections and other elements of urban transportation networks more efficiently

The demonstrations will build on past findings about ICM to provide a first-hand evaluation of the real-world impact.  The new technology will avoid the dangers of text-messaging and other distractions behind the wheel that result in distracted driving.

The initiative is jointly sponsored by the Federal Highway Administration (FHWA), the Federal Transit Administration (FTA), and the Research and Innovative Technology Administration (RITA).

Below is a summary of the ICM Pioneer sites (courtesy of the ITS JPO):

Skyline of Dallas, Texas

ICM Pioneer Sites–Dallas, Texas

The Dallas-Fort Worth area is currently populated by 6 million people, and is growing by 1 million every 7 years. Travel demand and congestion in this area continue to grow. Dallas’ US-75 ICM Corridor is the highest volume and most critical transportation corridor in the region. It has major employment centers and while there is no room for expansion of the corridor, it will be impacted by major construction planned in the surrounding area.

Dallas is creating an operational entity responsible for all ICM activities. In this region, transit availability and capacity is being increased, park-and-ride facilities will be improved, and intelligent transportation system elements are being deployed in the field. In addition, HOV and HOT lanes will be added, and value-pricing strategies are being explored.

The Dallas US-75 ICM corridor was chosen as a site for Analysis, Modeling and Simulation (AMS) of ICM strategies. Click here to learn more about this site’s Experimental Plans and early results.

More on Dallas-Fort Worth, Texas’ ICM Corridor:

The Dallas, Texas application proposed U.S. route 75 from downtown Dallas to SH 121 with the North Dallas Toll Way to the west and DART and various arterials to the east as their corridor. The Dallas Area Rapid Transit Authority was the lead agency, accompanied by the City of Dallas, the City of Richardson, the City of Plano, the City of University Park, the Town of Highland Park, the North Central Texas Council of Governments, the North Texas Tollway Authority, and the TxDOT Dallas District. In addition to the expected freeway and arterial capabilities, the corridor includes HOV, tolling, express bus, and light rail.

ICM Pioneer Sites–San Diego, CaliforniaSkyline of San Diego, California

San Diego experiences significant traffic congestion during peak travel periods, has limited HOV and HOT lanes, and has limited transit capacity. The strong consortium of partnering agencies in San Diego is increasing multi-jurisdictional and multi-agency collaboration on corridor management. Together, they are introducing dynamic ramp metering to reduce arterial spillover and they are looking to collect arterial data to support efficient signal timing strategies. This ICM team is implementing dynamic variable pricing along 21 miles of managed lanes and pioneering congestion avoidance awards.

The San Diego I-15 ICM corridor was chosen as a site for Analysis, Modeling and Simulation (AMS) of ICM strategies. Check back in late 2009 for updates on this site’s Experimental Plans and early results.

More on San Diego, California’s ICM Corridor:

The San Diego, California application proposed I-15 from SR 52 in San Diego to SR 78 in Escondido as their corridor. The San Diego Association of Governments (SANDAG) was the lead agency, accompanied by Caltrans, the City of San Diego, the City of Escondido, the City of Poway, the Metropolitan Transit System, and the North County Transit District. In addition to the expected freeway and arterial capabilities, the corridor includes HOV, tolling, value pricing, express bus, and BRT.

Click here to read more.