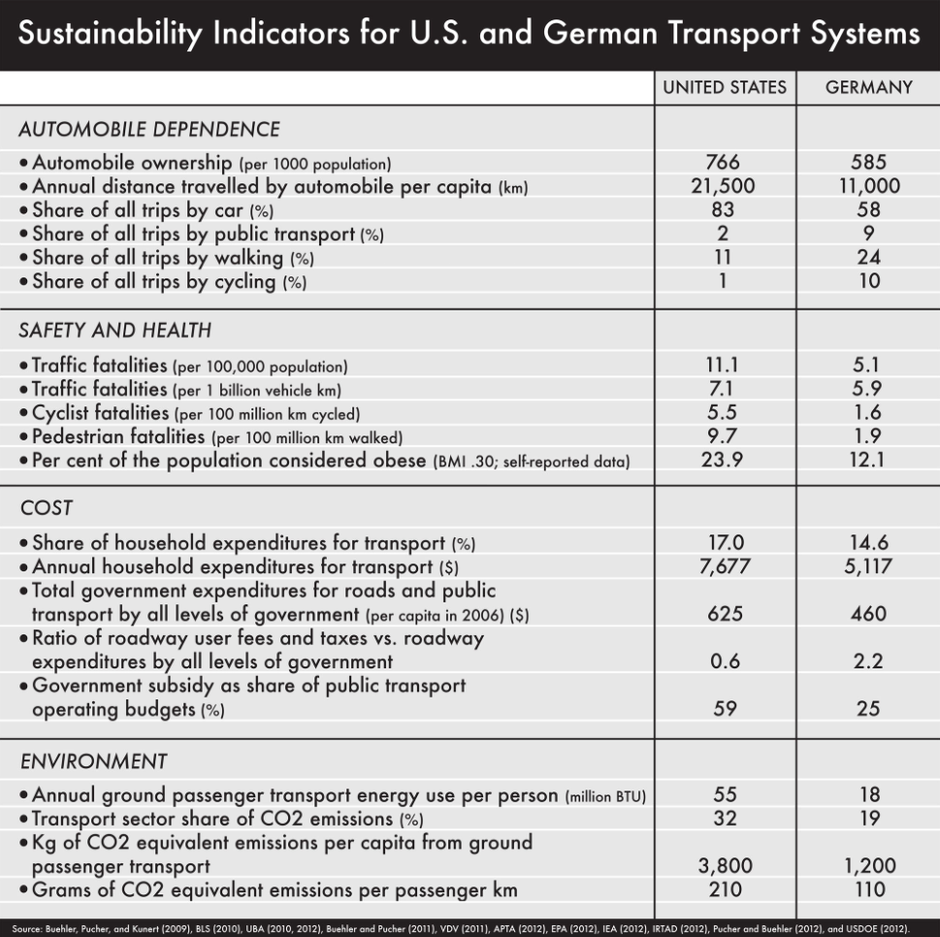
Chart of the day: Sustainability Indicators – All the Ways Germany Is Less Car-Reliant Than the U.S., in 1 Chart

February 4, 2015 at 6:02 pm

via Citylab

This interesting chart was a part of a CityLab article that analyses how Germany is less car dependent than the United States by looking data from comparable cities in each of these nations.  What caught my attention, among the many things, is the difference in the carbon footprint.  In the US, Transport sector alone accounts for 32% of our overall CO2 emissions whereas in Germany it is only 19%.  If we ever get around to implementing a carbon tax, it could fall precipitously but I don’t see that happening anytime soon, given the current political discourse.

The data come from a recent comparison of German and U.S. planning approaches led by transport scholar Ralph Buehler of Virginia Tech. Drilling down to the city level, Buehler and collaborators find more of the same driving trends in an analysis of two large metros from each country: Washington, D.C., and Stuttgart.


Job Alert: Transportation Research Analyst – World Resources Institute/EMBARQ @ Washington, DC

February 4, 2015 at 12:48 pm

EMBARQ seeks a full-time  to provide research, data analysis and other support to its Integrated Transport team which conducts global research on sustainable transport and urban development, and supports Cities Network projects in Mexico, Brazil, Turkey, India, and China. The research assistant will support several projects related to sustainable mobility. The projects will require working with transit planning and operations; economic, social and environmental impact analysis of transport projects; and sustainable transport best practices, policies, institutions, and finance.

The position is located in WRI’s Washington, D.C. office. It offers the opportunity to connect with sustainable mobility and urban development experts, and key stakeholders around the world. Salary will be commensurate with experience. Competitive WRI benefits package.

Responsibilities

Research & Analysis

  • Conduct desktop research, literature reviews and synthesize findings;
  • Assist with transport data collection, verification, visualization, and analysis, both qualitative and quantitative;
  • Research, document, evaluate, and analyze emerging trends, best practices, and policies in urban mobility and city planning.
  • Support the maintenance of shared databases;

Writing & Editing

  • Contribute written and graphic content to publications, reports, papers, and presentations
  • Support internal reviews of EMBARQ publications
  • Prepare project-related content for publication on EMBARQ.org and EMBARQ’s blog The City Fix.

Program Support

  • Interact with WRI/EMBARQ Network members (China, India, Turkey, Brazil and México) as well as partner institutions for data exchange, information requests and project coordination
  • Support contract and proposal development, reporting, and tracking
  • Support conferences/events planning
Qualifications
  • Masters degree in transport planning/engineering, or urban/regional planning with a focus on transportation
  • Previous coursework, work experience, internships or papers in urban transportation planning are desirable
  • Strong quantitative, analytical, and research skills
  • Enthusiasm to work on sustainability issues and in developing countries.
  • Detail-oriented and organized thinker.
  • Ability to work well in multi-disciplinary and multi-cultural teams, juggle multiple priorities and work under tight deadlines
  • Enjoys working in a fast-paced, results oriented non-profit environment
  • Experience with quantitative analysis of data with software such as Excel, STATA, and ability to learn new software and computer systems quickly
  • Competence to undertake high-profile research assignments with minimal supervision
  • Excellent written and spoken English.
  • Knowledge of Mandarin, Spanish, Portuguese, and/or Turkish, is desirable
  • Some experience using ArcGIS or similar mapping software, or familiarity with at least one transport modelling software such as VISUM or TransCAD would be a plus.

Final candidates will be required to take a writing test.

Duration: Regular full-time

Salary:  Salary is commensurate with experience and skills. WRI offers a generous, comprehensive benefits package.

Location: Washington, DC

Qualified applicants should apply online at www.wri.org/careers. All applications must be submitted online through this career portal in order to be formally considered. 

The World Resources Institute (http://www.wri.org/wri) is an environmental and development research and policy organization that creates solutions to protect the Earth and improve people’s lives. As an Equal Opportunity Employer, it is WRI’s policy to recruit, hire, and provide opportunities for advancement in all job classifications without regard to race, color, religion, sex, national origin, age, citizenship, marital status, sexual orientation, parental status, protected veteran status, or disability. WRI’s global agenda requires a staff that is diverse – with respect to race, gender, cultural, and international background. Diverse perspectives and experience enhance the way WRI selects and approaches issues, as well as the creativity and applicability of WRI’s policy research and analysis. WRI, therefore, encourages applications from U.S. minorities, persons from other countries (especially developing nations), and from women of all backgrounds.

About WRI

Established in 1982, WRI is a non-profit 501(c)(3) organization respected globally by policymakers, non-governmental organizations, and corporate leaders.

WRI’s reputation is grounded in its excellent analysis, non-partisan approach, and high-impact results. We measure our success based on how our work helps to create real-world change on the ground—and approach we call “Managing for Results.”

WRI’s work is united by and driven by our values: Innovation, Integrity, Urgency, Independence, and Respect.

WRI fosters a culture of innovative ideas, working collaboratively, and thinking independently. WRI employees are driven by the organization’s mission and have the satisfaction of helping to create a more prosperous and healthy planet.

Learn more about our organization at www.wri.org.

Chart of the day: Net change in Highway Trust Fund Balance Since 1957

January 28, 2015 at 11:46 am

This chart was included as part of a brilliant blog post by our friends at TransitLabs, which analyses the various issues surrounding the perennial shortfalls that dog the highway trust fund (aka Gas tax).  Highly recommend reading the entire blog titled “Why the Trust Fund Keeps Running Out” and explore the beautiful visualizations that accompany the story.

Image courtesy: Transitlabs

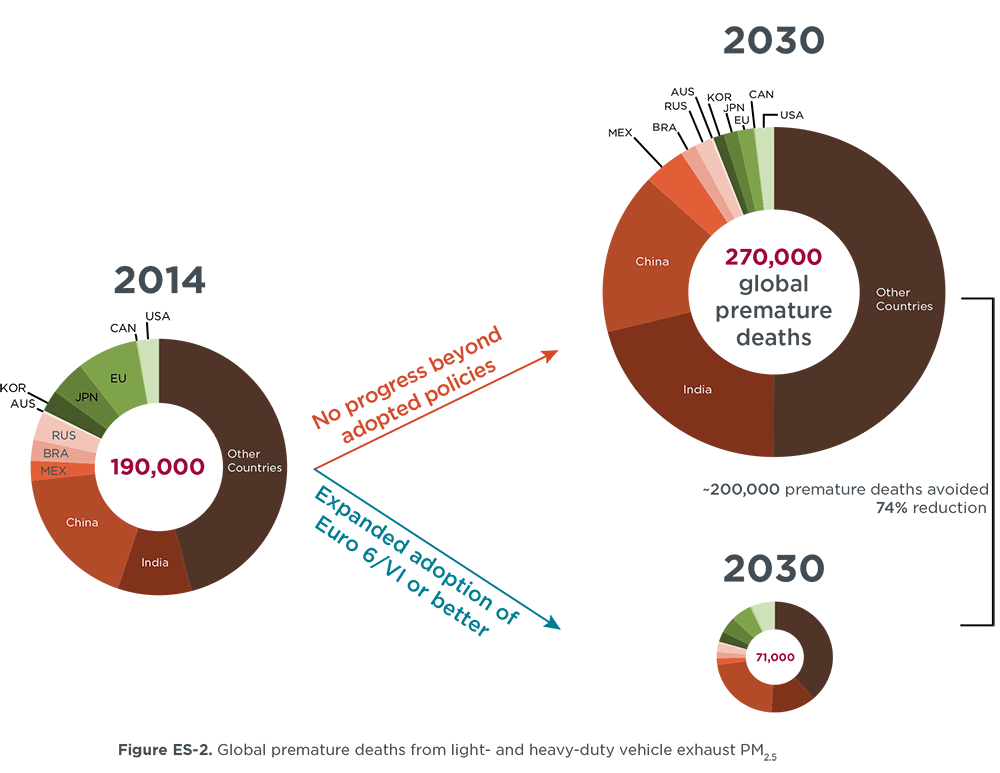
Chart of the day: Implementing world-class vehicle emissions standards would reduce transport air pollution-related mortality from approximately 270,000 deaths to 71,000 deaths in 2030 globally

January 14, 2015 at 12:34 pm

This chart comes from a report titled “The state of clean transport policy: A 2014 synthesis of vehicle and fuel policy developments” published by the International Council on Clean Transportation.

Air-pollutant emissions and public health

Exposure to outdoor air pollution resulted in 3.2 million early deaths worldwide in 2010 and ranks among the top ten health risks. Motorized transport is a major contributor to outdoor air pollution, particularly near major roadways and in urban areas with a high concentration of vehicle activity. The vast majority of health impacts from vehicle activity occur in India, China, Brazil, Mexico, and the countries in the Asia-Pacific region, Latin America, the Middle East, and Africa. Implementing world-class vehicle emissions standards would reduce transport air pollution-related mortality from approximately 270,000 deaths to 71,000 deaths in 2030 globally, with benefits that are greatly concentrated in major cities. These estimates are limited strictly to exhaust emissions of fine particulate matter (PM2.5) from light- and heavy-duty on-road vehicles in urban areas and thus represent a conservative estimate of health impacts from transport.


Image courtesy: theICCT.org

This report summarizes advances in national and international regulations intended to reduce energy use, mitigate climate change, and control air pollution from motor vehicles and fuels across eleven major vehicle markets from January 2013 through August 2014. These eleven vehicle markets—China, the U.S., the European Union, Japan, Brazil, India, Russia, Canada, South Korea, Australia, and Mexico—represented 85% of total vehicle sales in 2013. Click here to access the report and the presser.

Chart of the day: The Bike Sharing World – 2014 – Year End Data

January 6, 2015 at 5:52 pm

via The Bike-sharing Blog

Image Courtesy: Russell Meddin bikesharephiladelphia.org via The Bike-sharing Blog

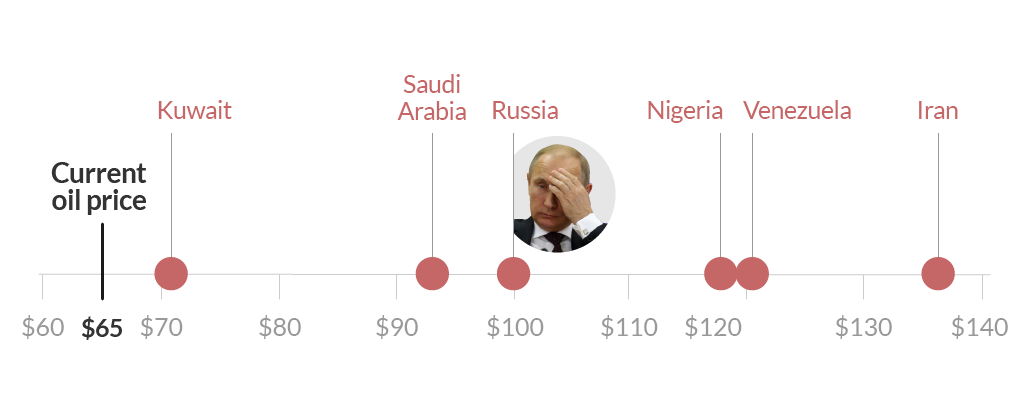
Want to understand the nexus between oil prices and geopolitics? This should help

December 3, 2014 at 6:42 pm

via CNN

With plunging oil prices, the consumers are clearly thrilled but the oil producers, particularly OPEC, not so much.  This video below and the image, courtesy of CNN, clearly explains the gigantic complexities that impacts the price of oil. With $2/gallon already in some parts of the US, the current geopolitical scene will get even more volatile in the months ahead.

Image courtesy: CNN Money

How much energy does the Transport sector consume in OECD countries? IEA data shows 90% of energy is consumed by vehicles on roads

November 25, 2014 at 3:52 pm

Image courtesy: IEA.org

Some interesting nuggets from IEA:

  • Since 1990, the domestic transport sector has accounted for the largest share of total final energy consumption, more than 30%, in the 24 OECD countries.
  • Within the sector, road transport dominates energy consumption, at 90% in 2011, as shown in this chart above based on the IEA energy efficiency indicators database.
  • Further disaggregated data by segment and vehicle type indicate that consumption by passenger cars is a key driver (64%) for road transport, and thus for global energy consumption trends.

Click here to learn more.


Infograph: AAA’s Thanksgiving Travel Forecast – 46.3 million Americans will travel at least 50 miles from home

November 21, 2014 at 5:44 pm

With gas prices falling faster than a drop of water from the sky (as we speak, the national average is well below $3 – the 1st time since Dec 22, 2010), you can expect more Americans tempted to drive instead of opting for other modes of transportation.  AAA expects the travelers to spend an average of $573 over the course of their holiday travels.  Click here to view the complete AAA/IHS Global Insight 2014 Thanksgiving Travel Forecast.

Image courtesy: Newsroom.AAA.com via cspnet.com

Infograph: Eurostar completes 20 years in service; shows impressive list of numbers and stars who enjoyed the service

November 11, 2014 at 5:25 pm

via The Daily Mail

No doubt. Eurostar is impressive all around and the infograph below captures it all succinctly.. What’s more exciting? The upcoming direct connection between London and Amsterdam starting 2o16? Imagine catching the train with your bike in London and riding around Amsterdam all day in your own bike. Drool!

Image Courtesy: the Daily Mail


Check out the Daily Mail article here.

Infographic: The States Where Electric Car Sales Are Skyrocketing

October 28, 2014 at 12:15 pm

via Forbes/Statista

Image courtesy: Statista via Forbes

Click here for the accompanying story